Slide 1
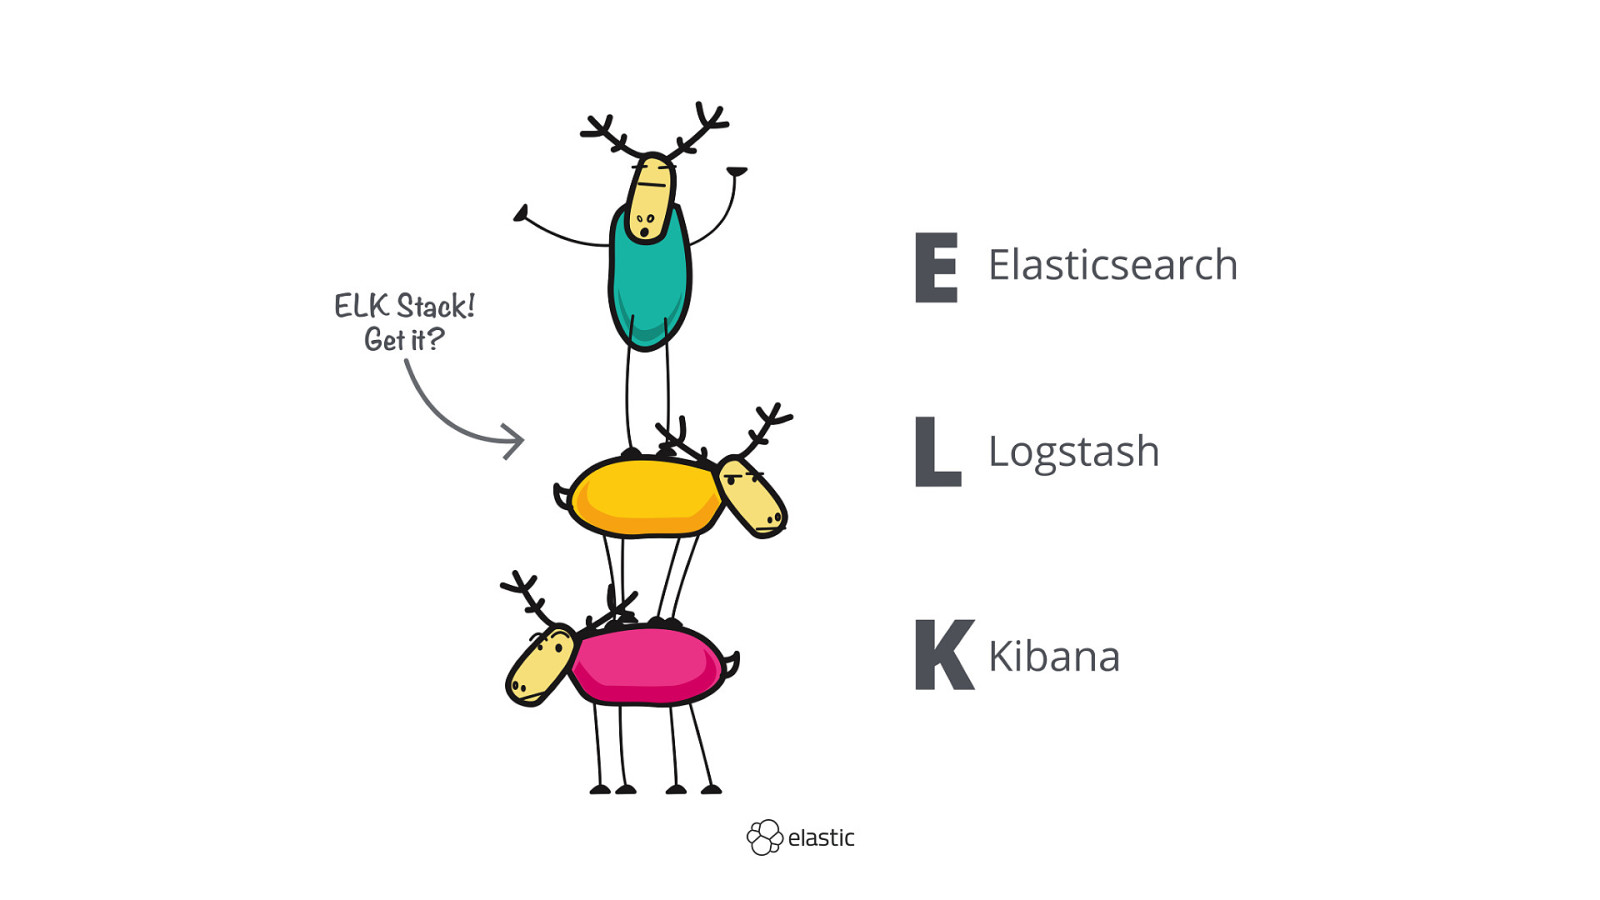
Slide 2

Slide 3

Slide 4

Slide 5

Slide 6

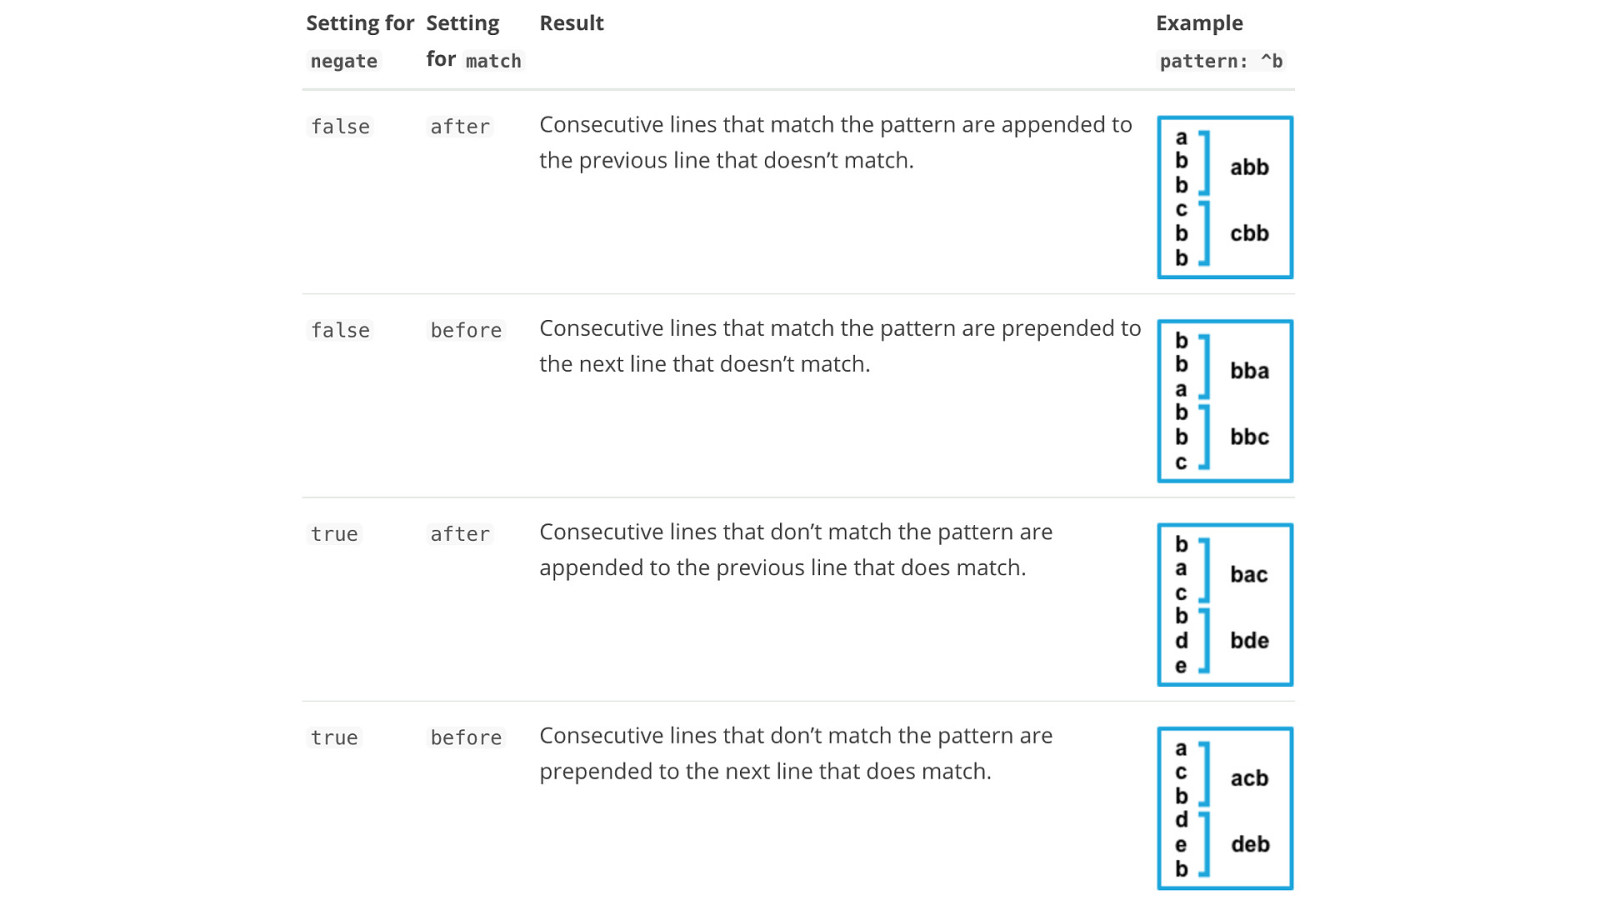
How? vs !
Slide 7

Developer
Slide 8

Disclaimer I build highly monitored Hello World apps
Slide 9

Disclaimer This is not a training https://training.elastic.co
Slide 10

Slide 11

Slide 12

Slide 13

Slide 14
Slide 15

Slide 16

Slide 17

Slide 18

Slide 19
Slide 20
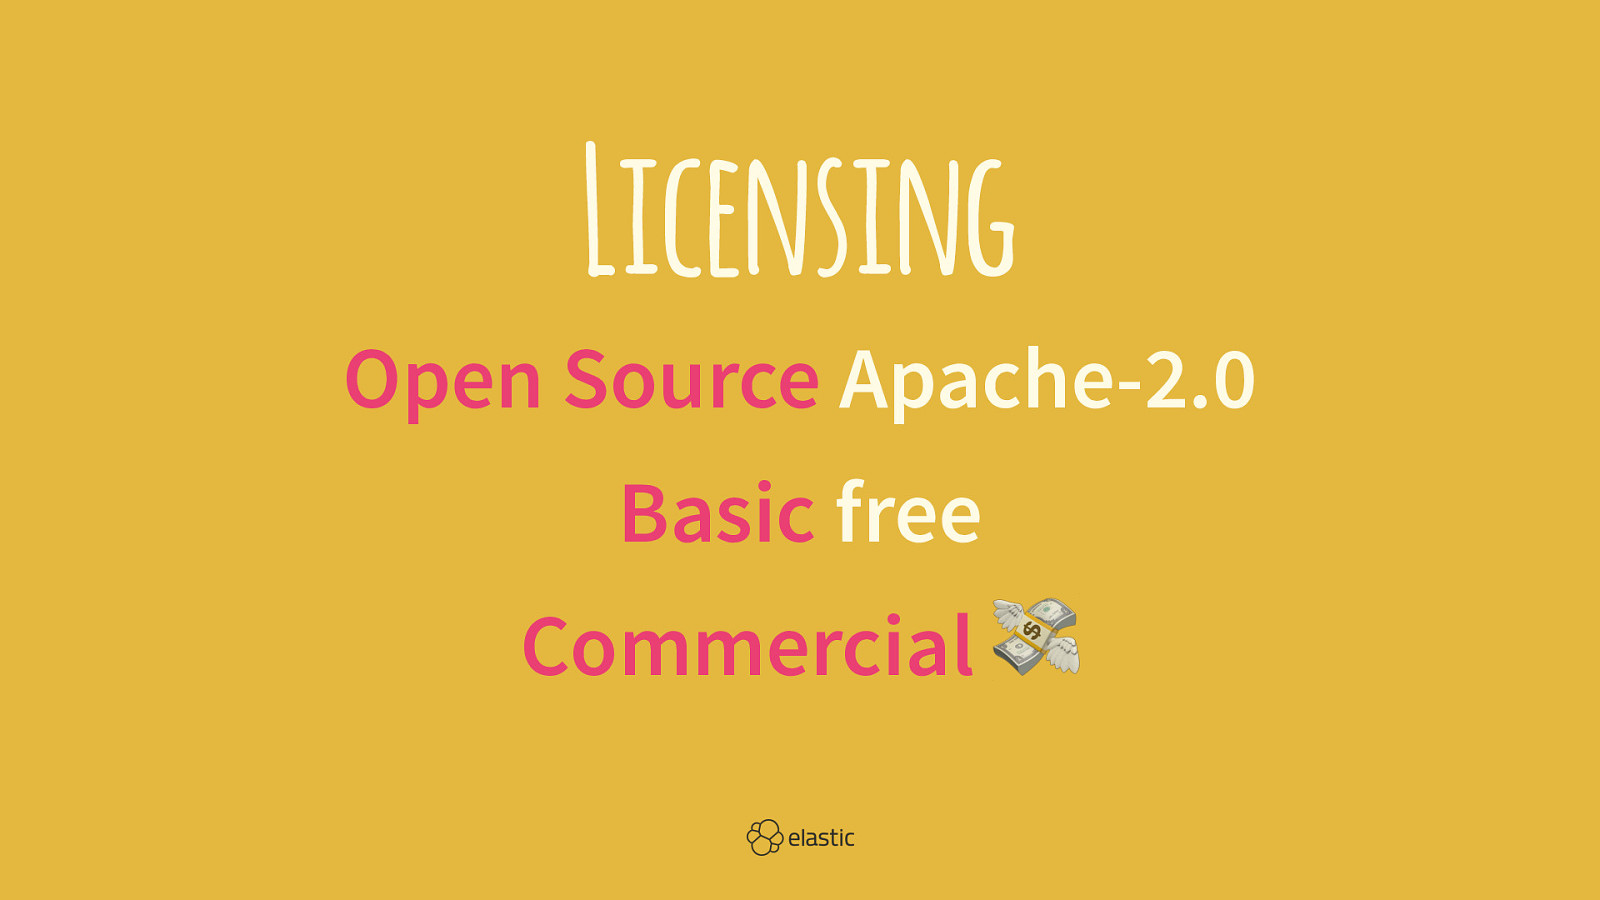
Licensing Open Source Apache-2.0 Basic free Commercial
Slide 21

Code https://github.com/xeraa/ microservice-monitoring
Slide 22

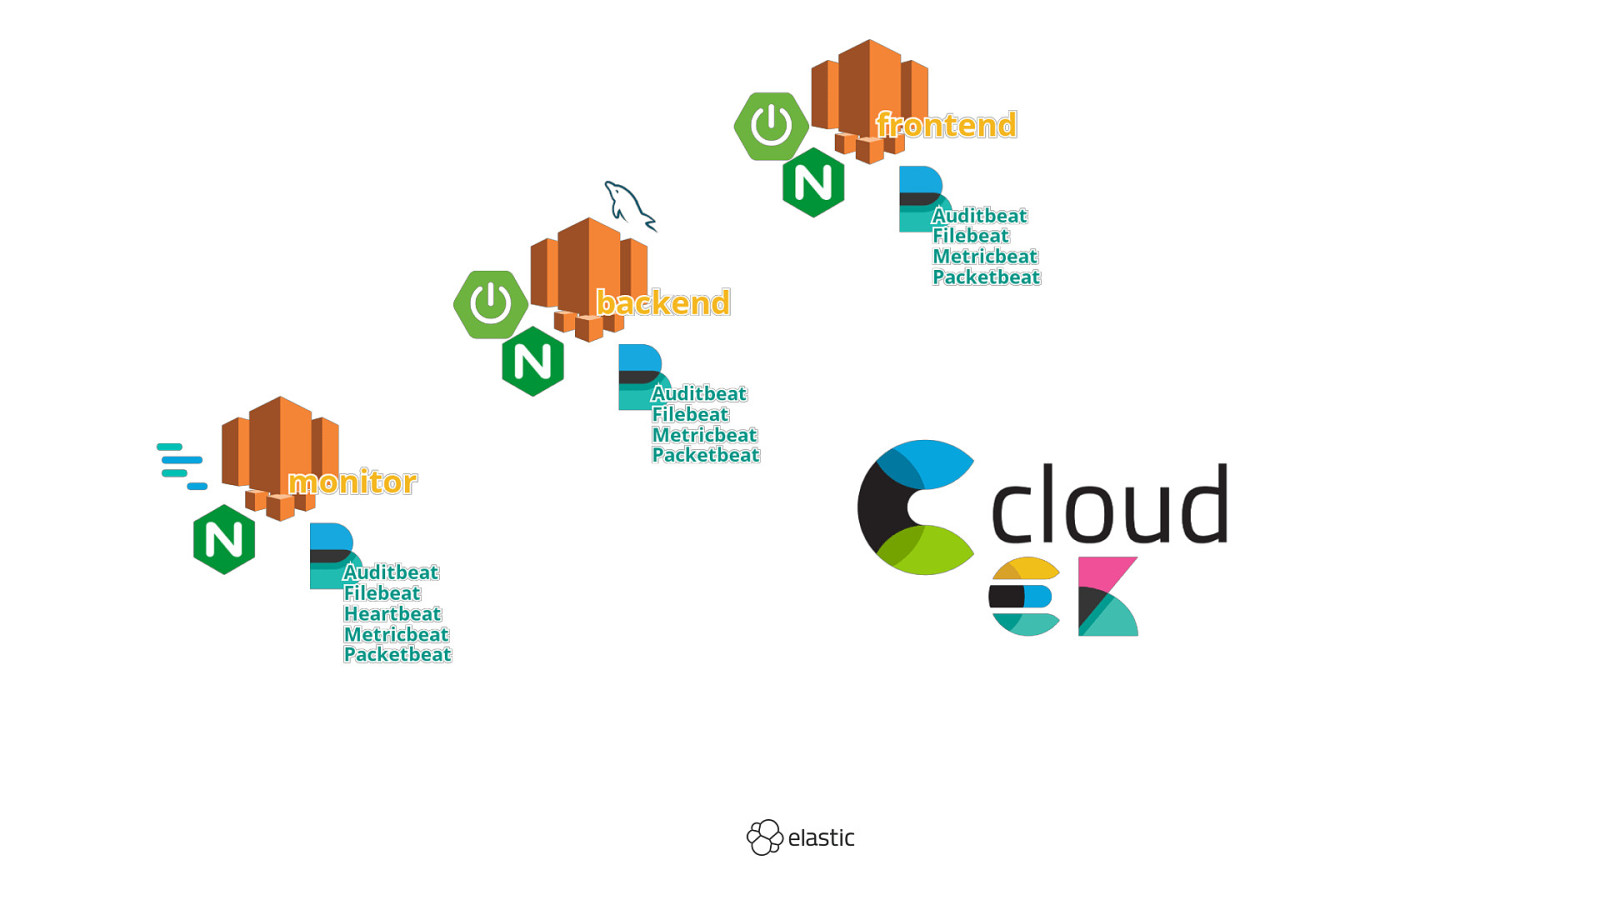
Simple No discovery, load-balancing,...
Slide 23

Slide 24

Slide 25
Slide 26

Slide 27

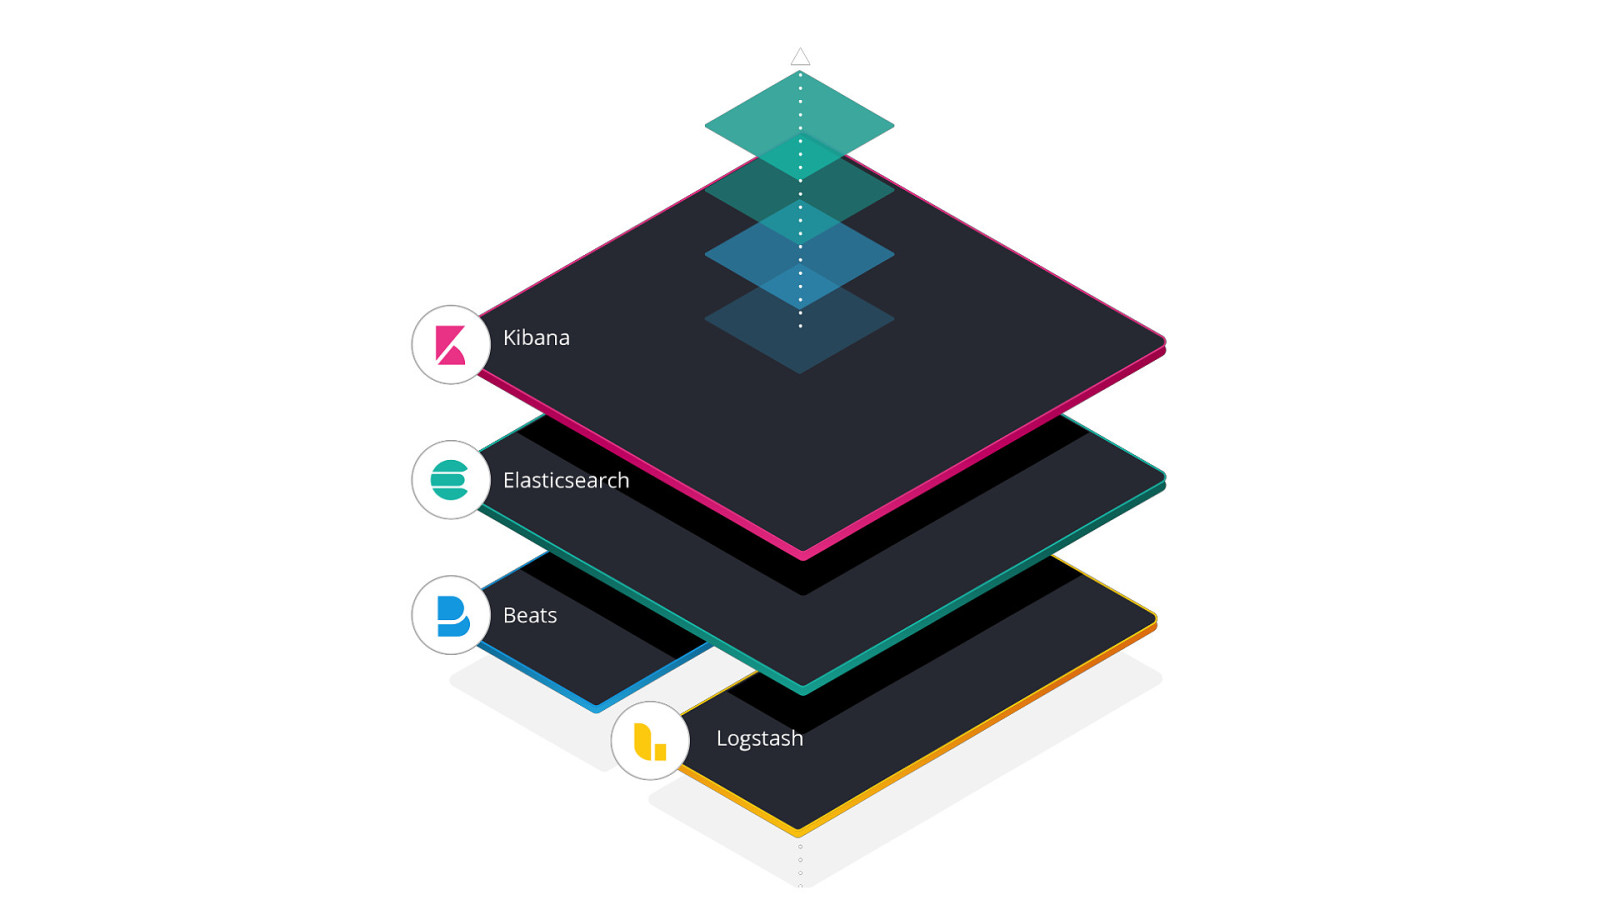
Kibana Monitoring Overview of the Elastic Stack components
Slide 28
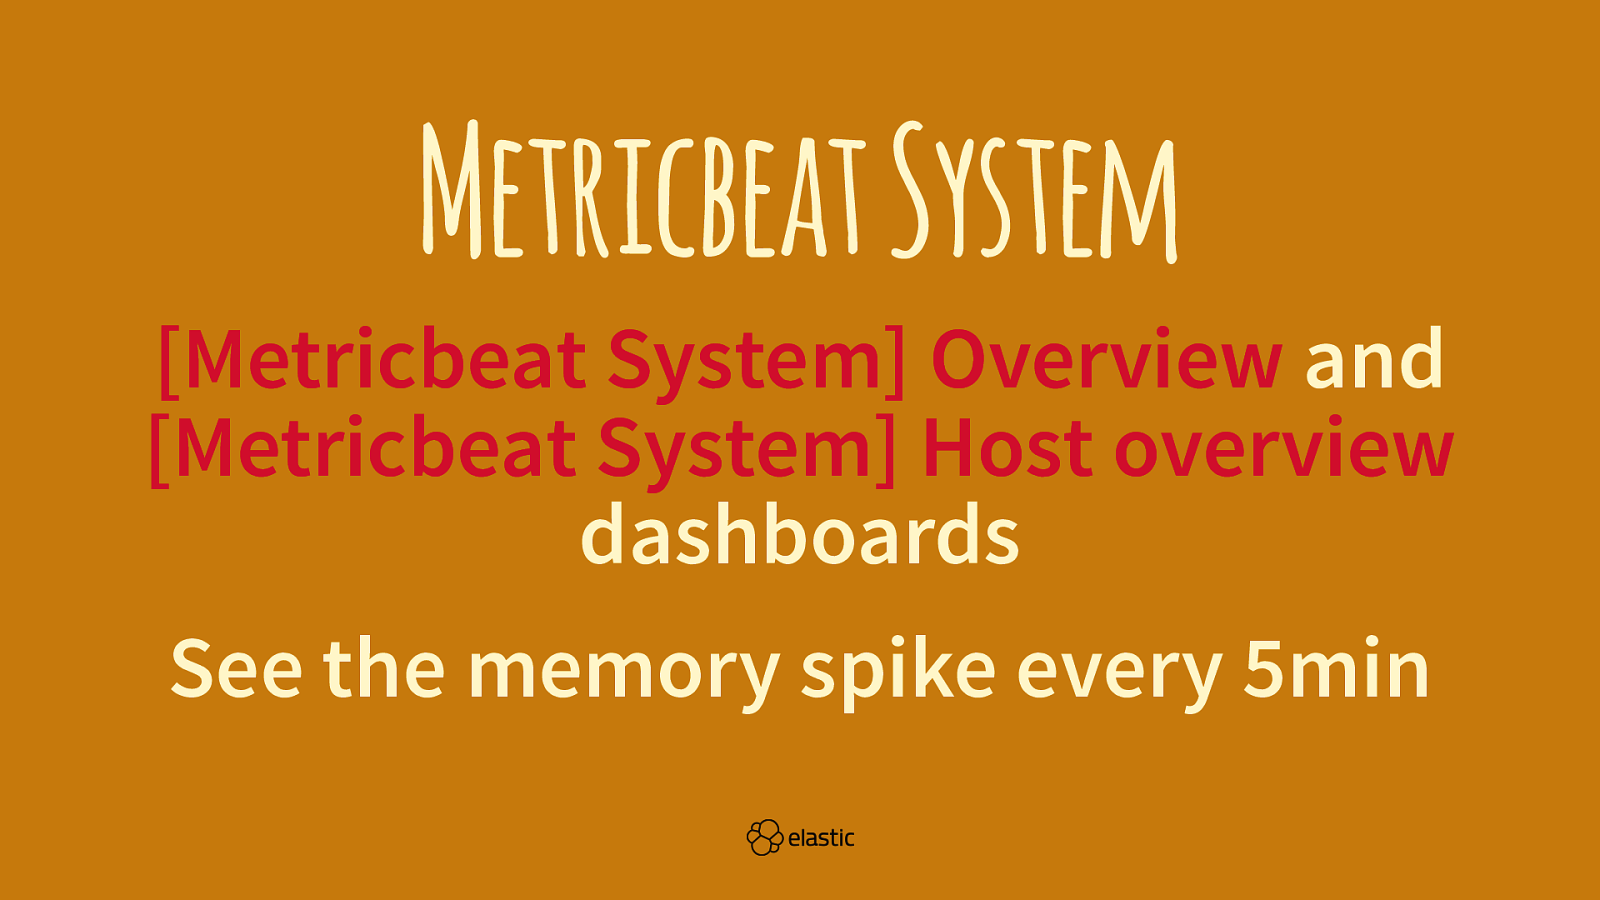
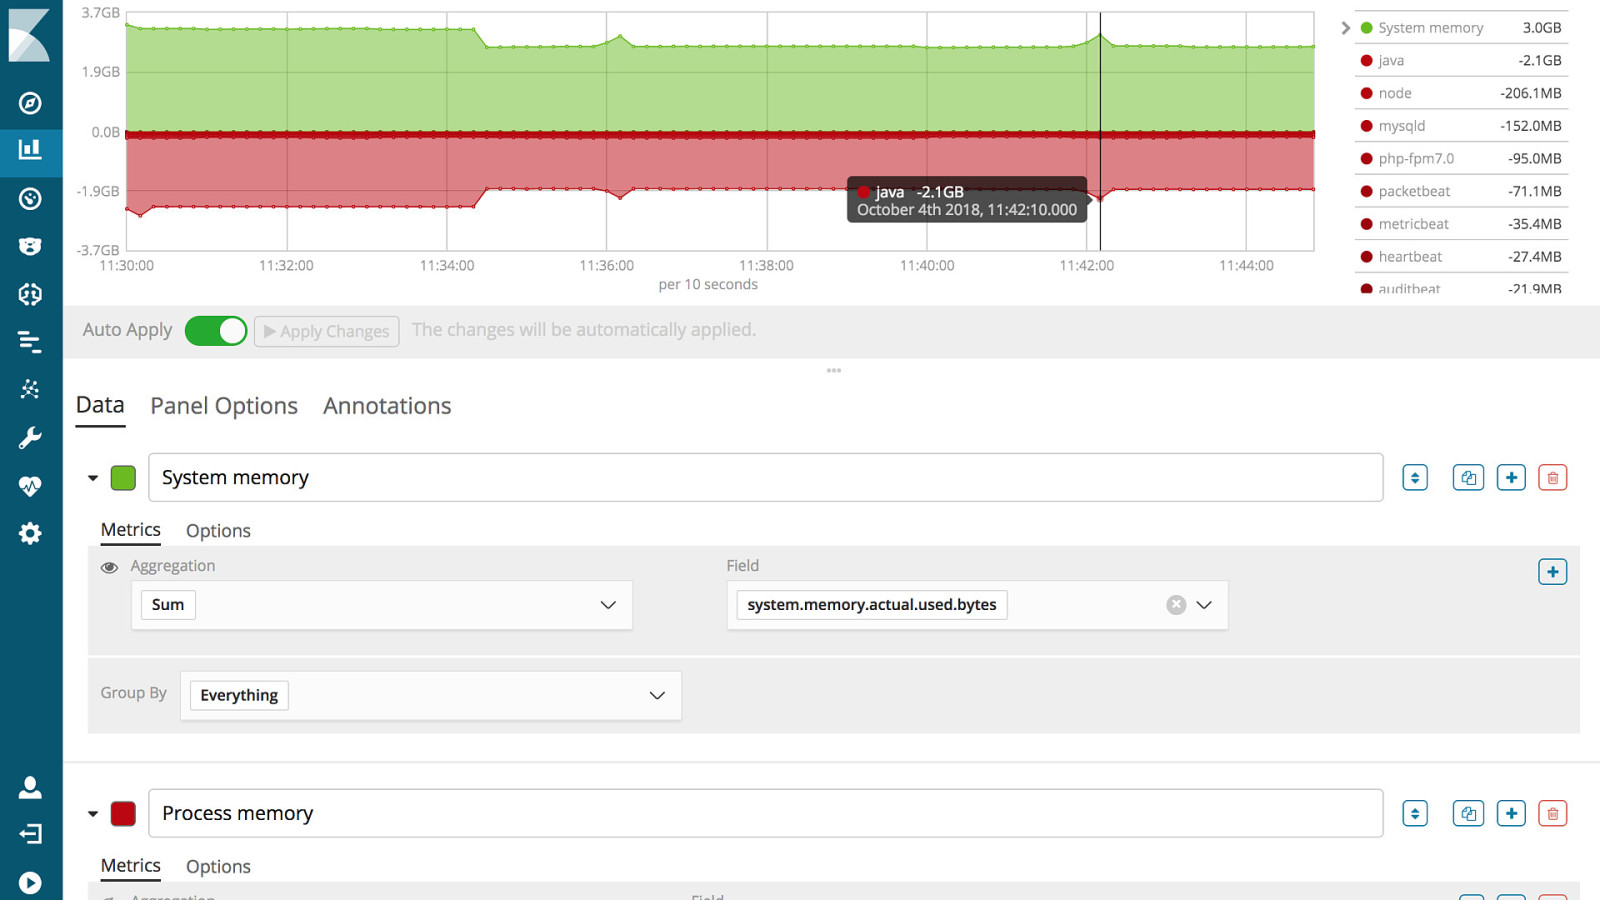
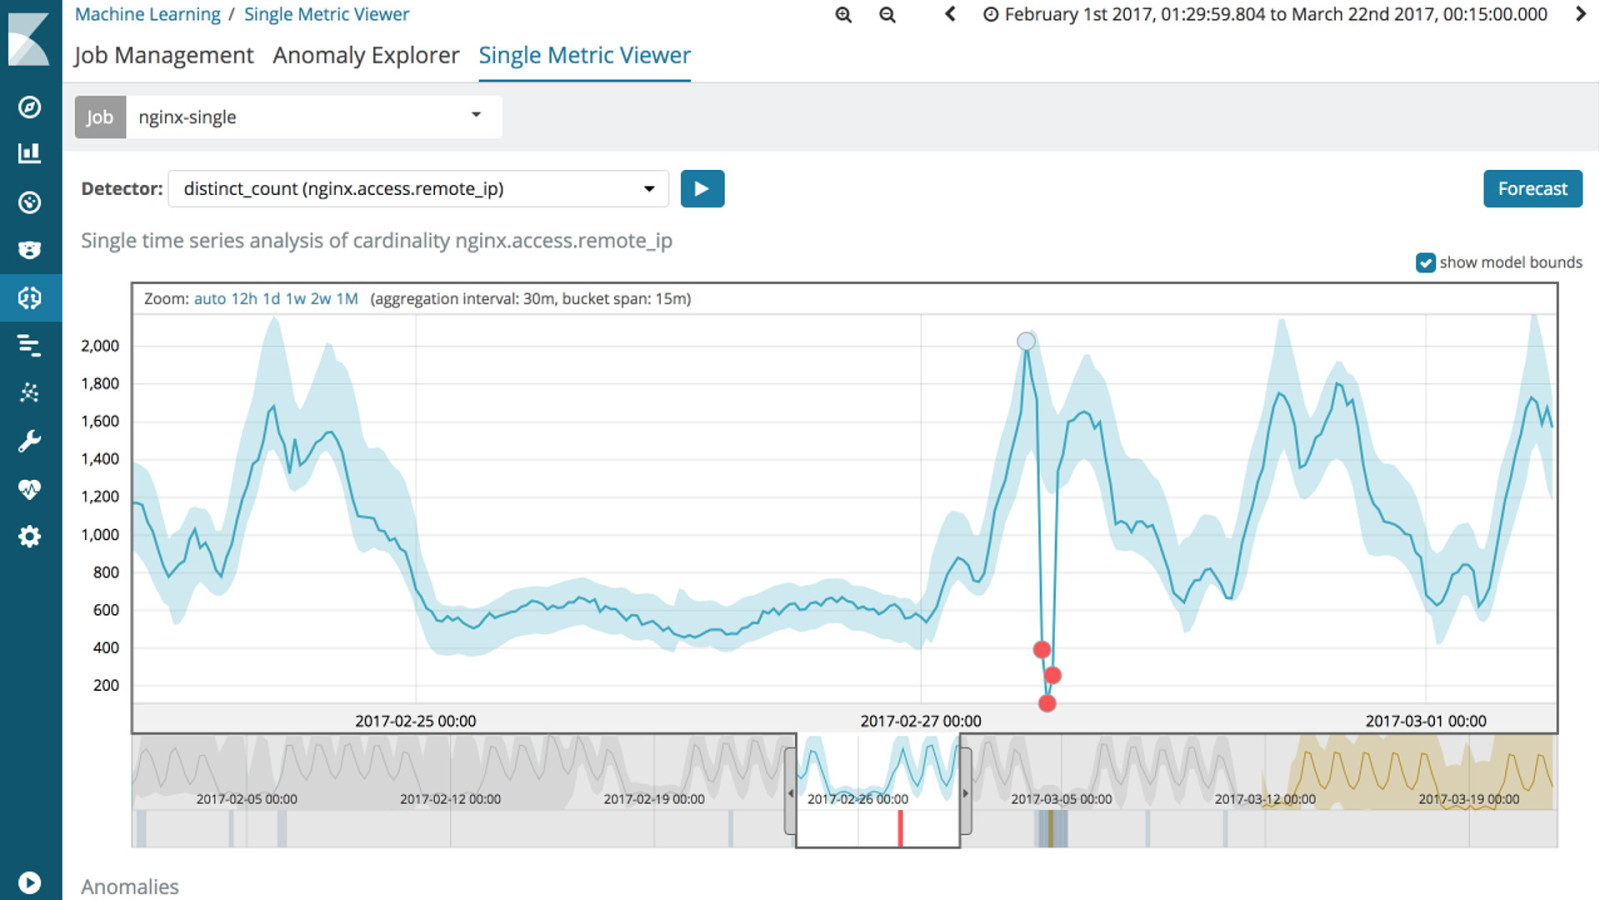
Metricbeat System [Metricbeat System] Overview and [Metricbeat System] Host overview dashboards See the memory spike every 5min
Slide 29
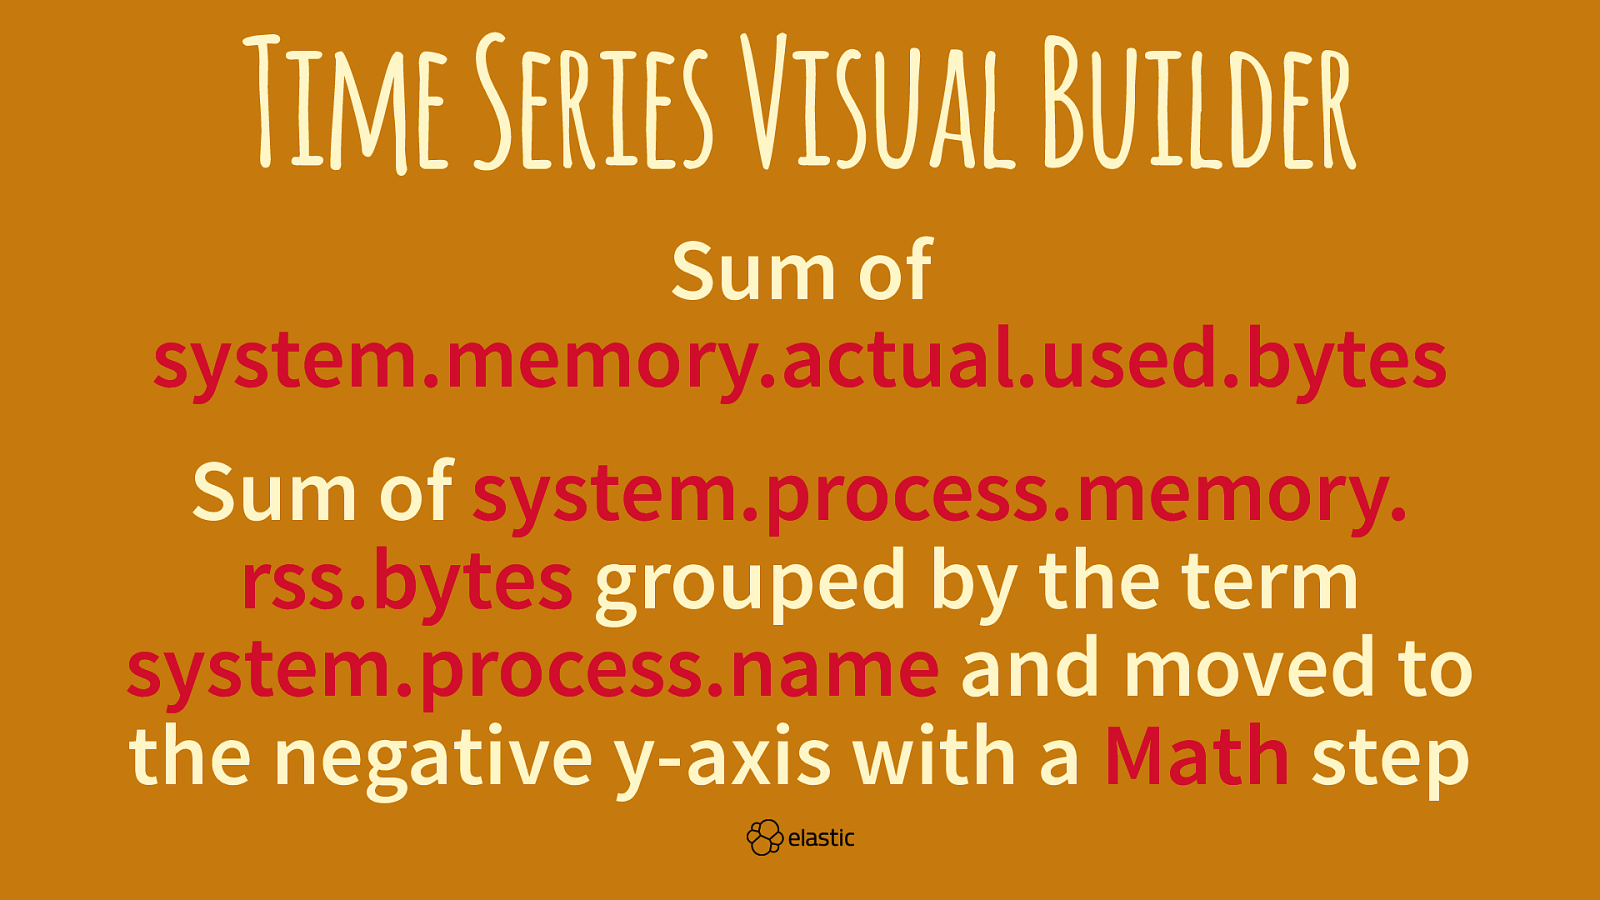
Time Series Visual Builder Sum of system.memory.actual.used.bytes Sum of system.process.memory. rss.bytes grouped by the term system.process.name and moved to the negative y-axis with a Math step
Slide 30
Slide 31
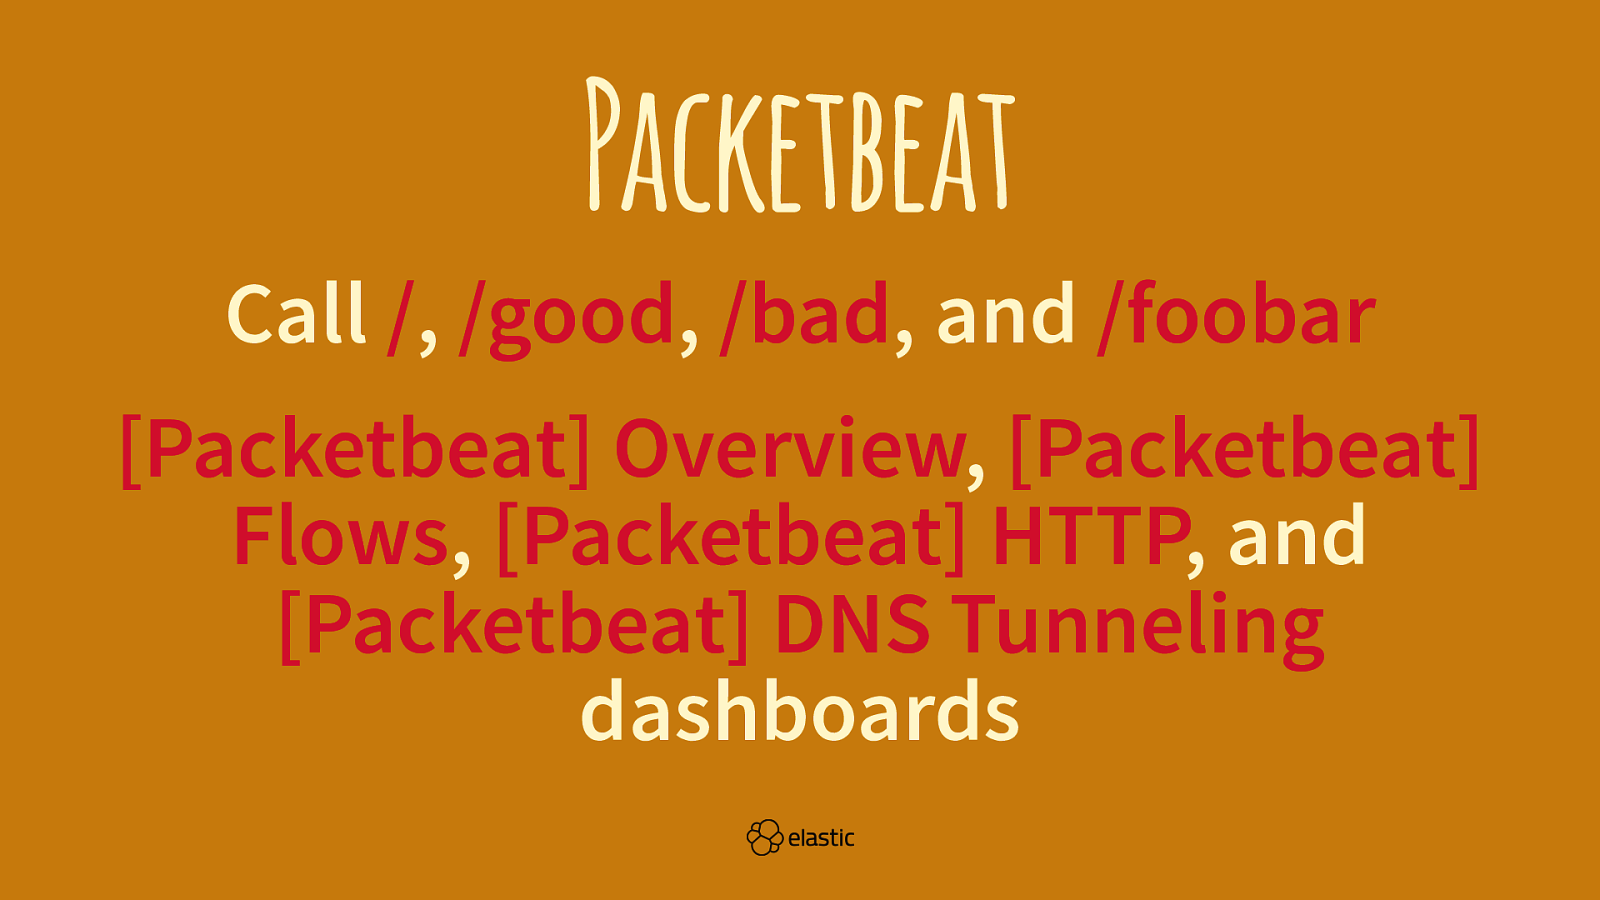
Packetbeat Call /, /good, /bad, and /foobar [Packetbeat] Overview, [Packetbeat] Flows, [Packetbeat] HTTP, and [Packetbeat] DNS Tunneling dashboards
Slide 32
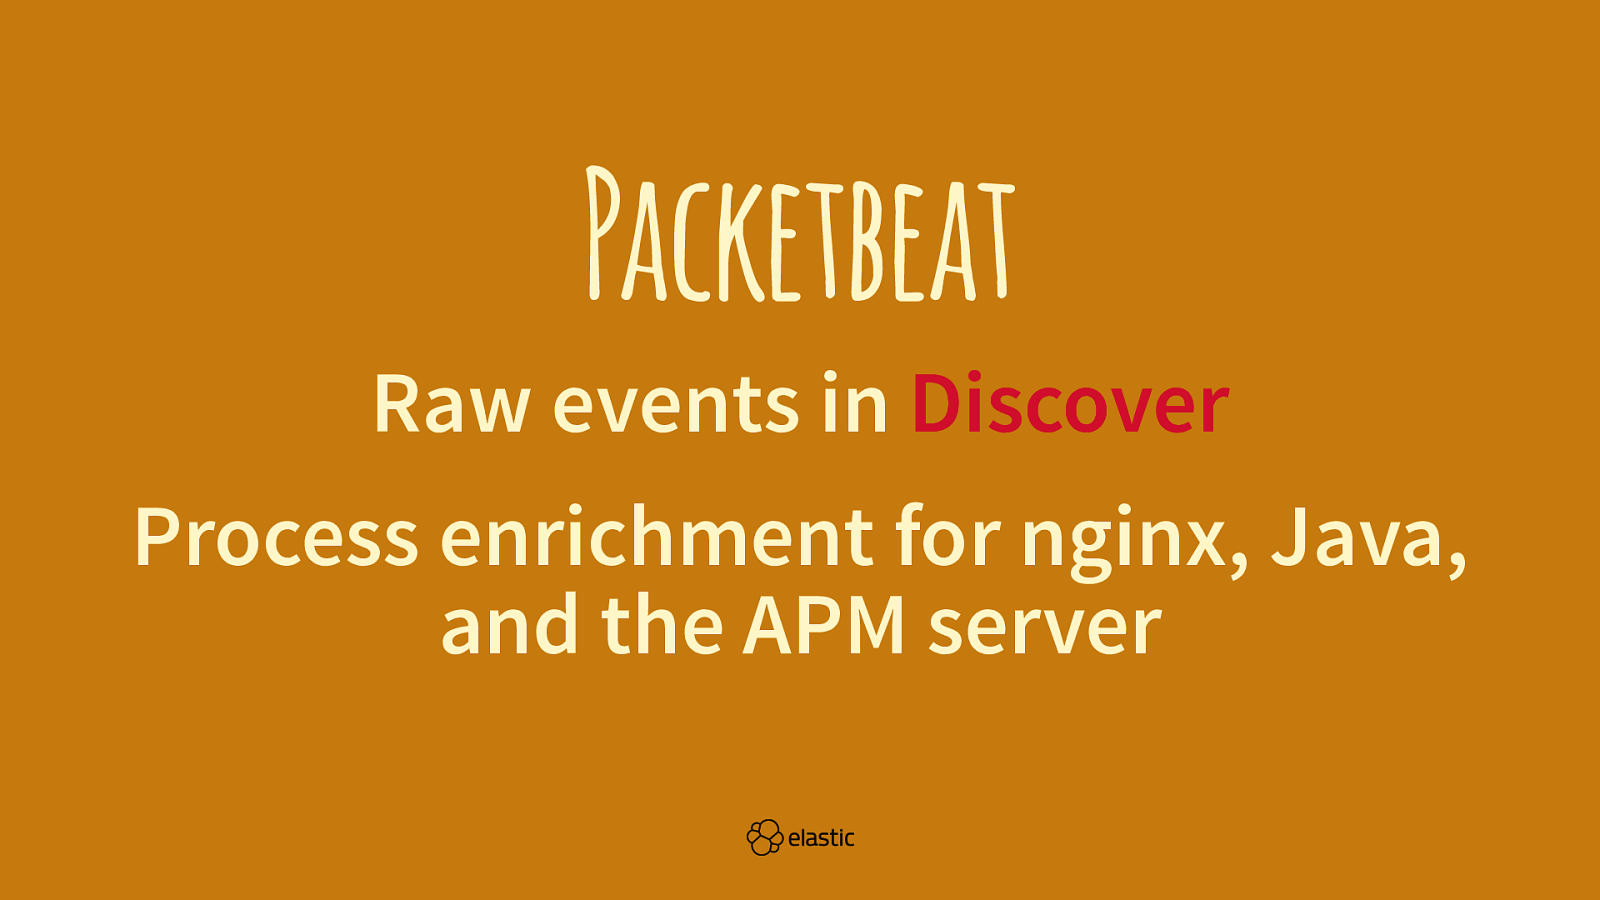
Packetbeat Raw events in Discover Process enrichment for nginx, Java, and the APM server
Slide 33
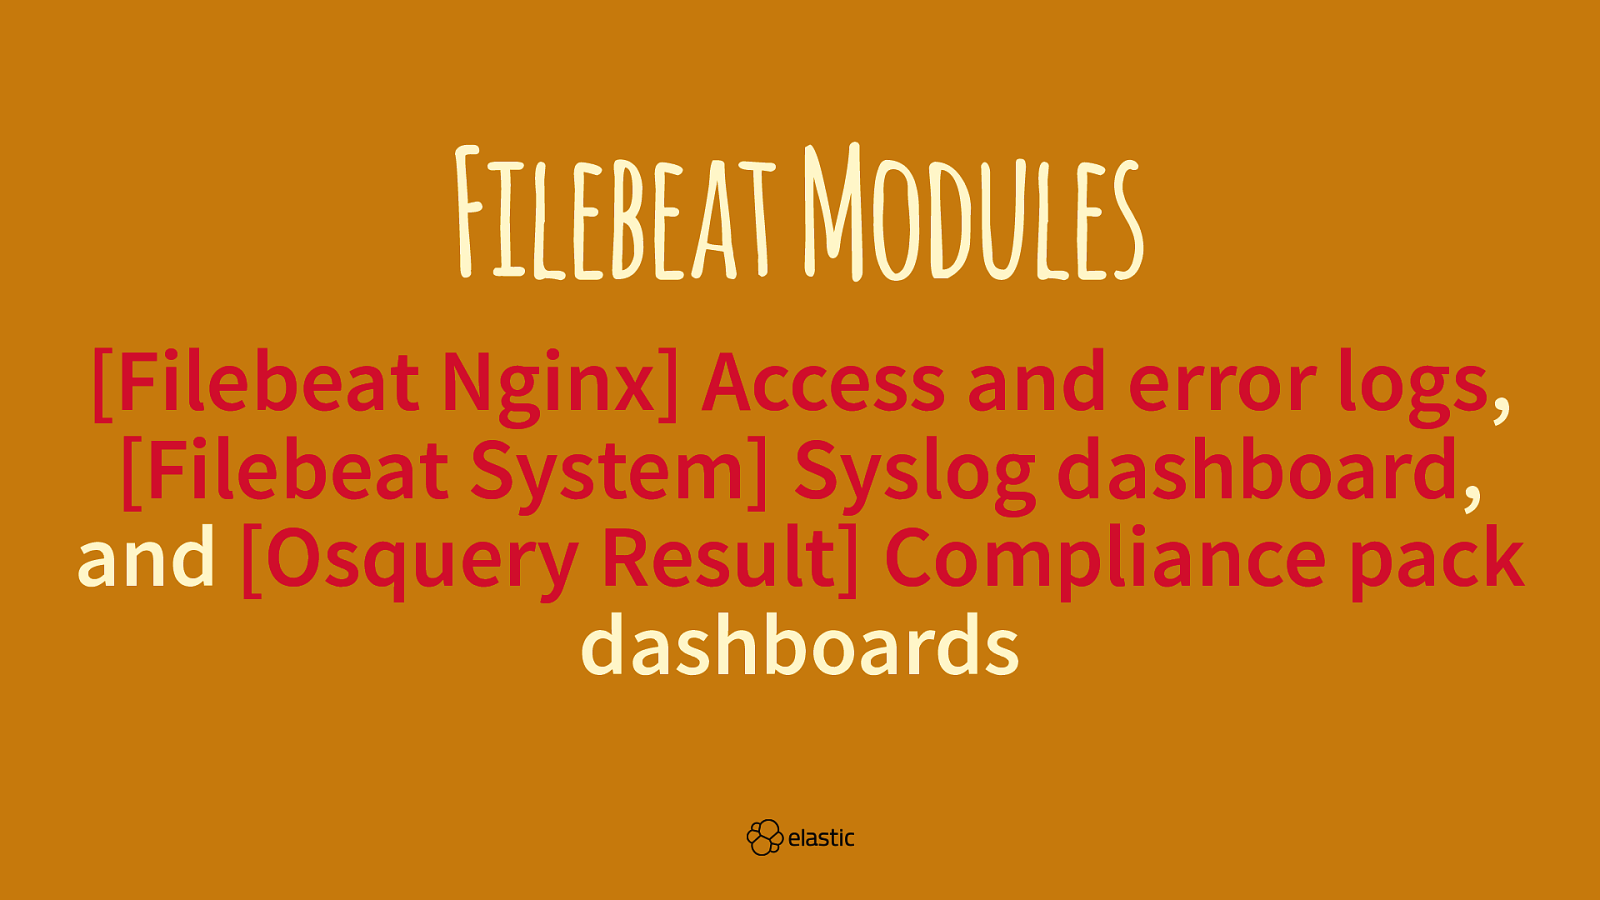
Filebeat Modules [Filebeat Nginx] Access and error logs, [Filebeat System] Syslog dashboard, and [Osquery Result] Compliance pack dashboards
Slide 34

Custom Log Files
Slide 35
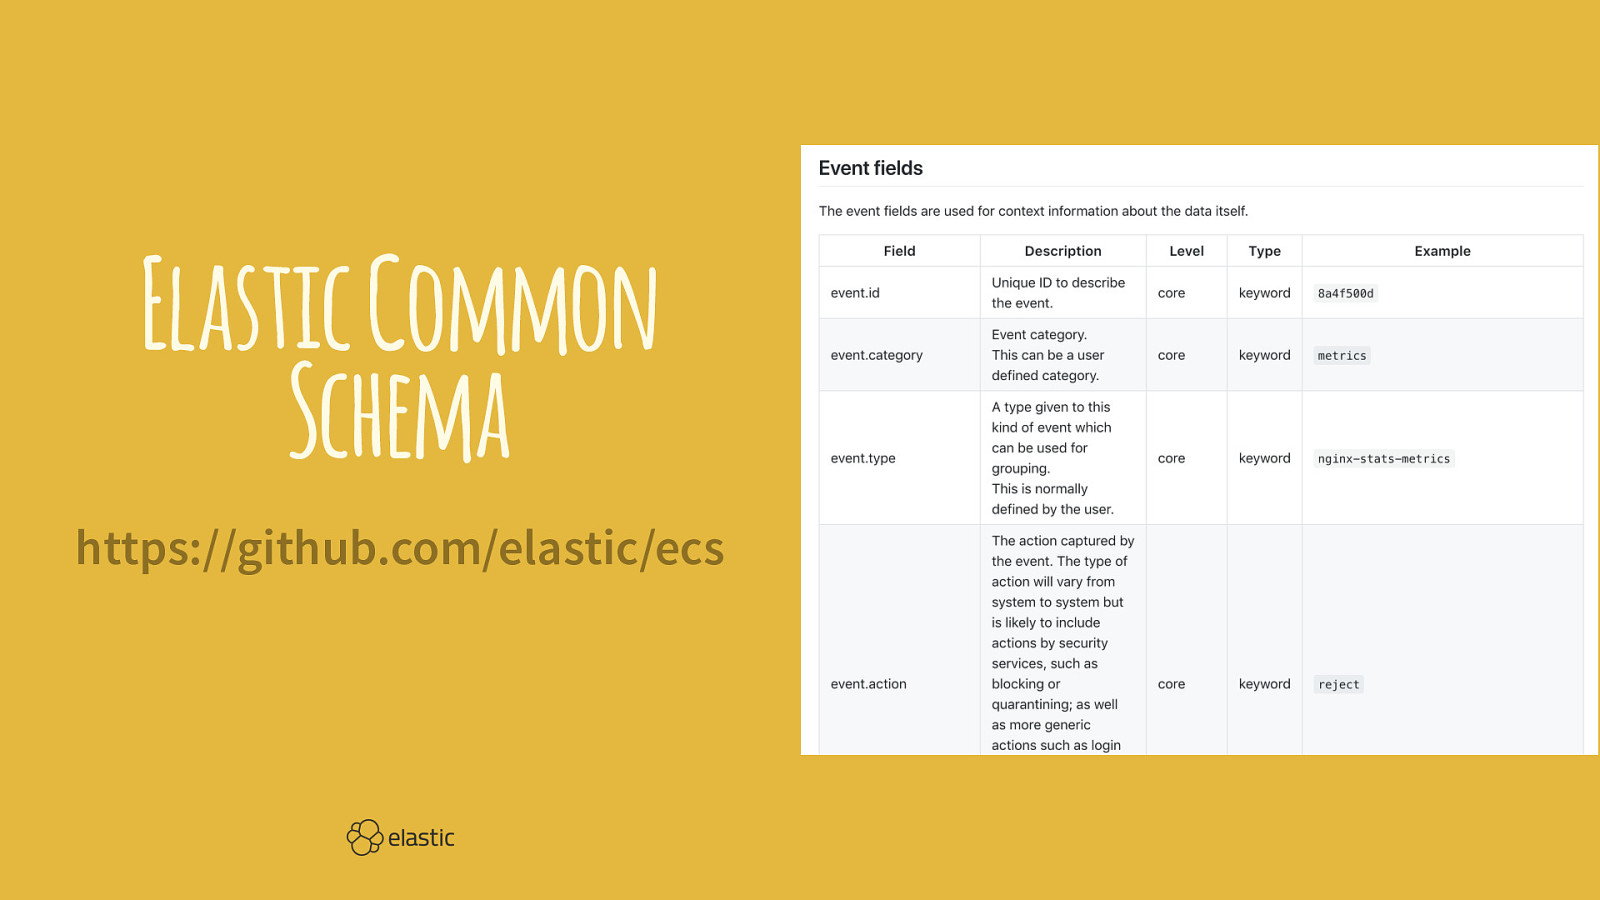
Elastic Common Schema https://github.com/elastic/ecs
Slide 36
Slide 37
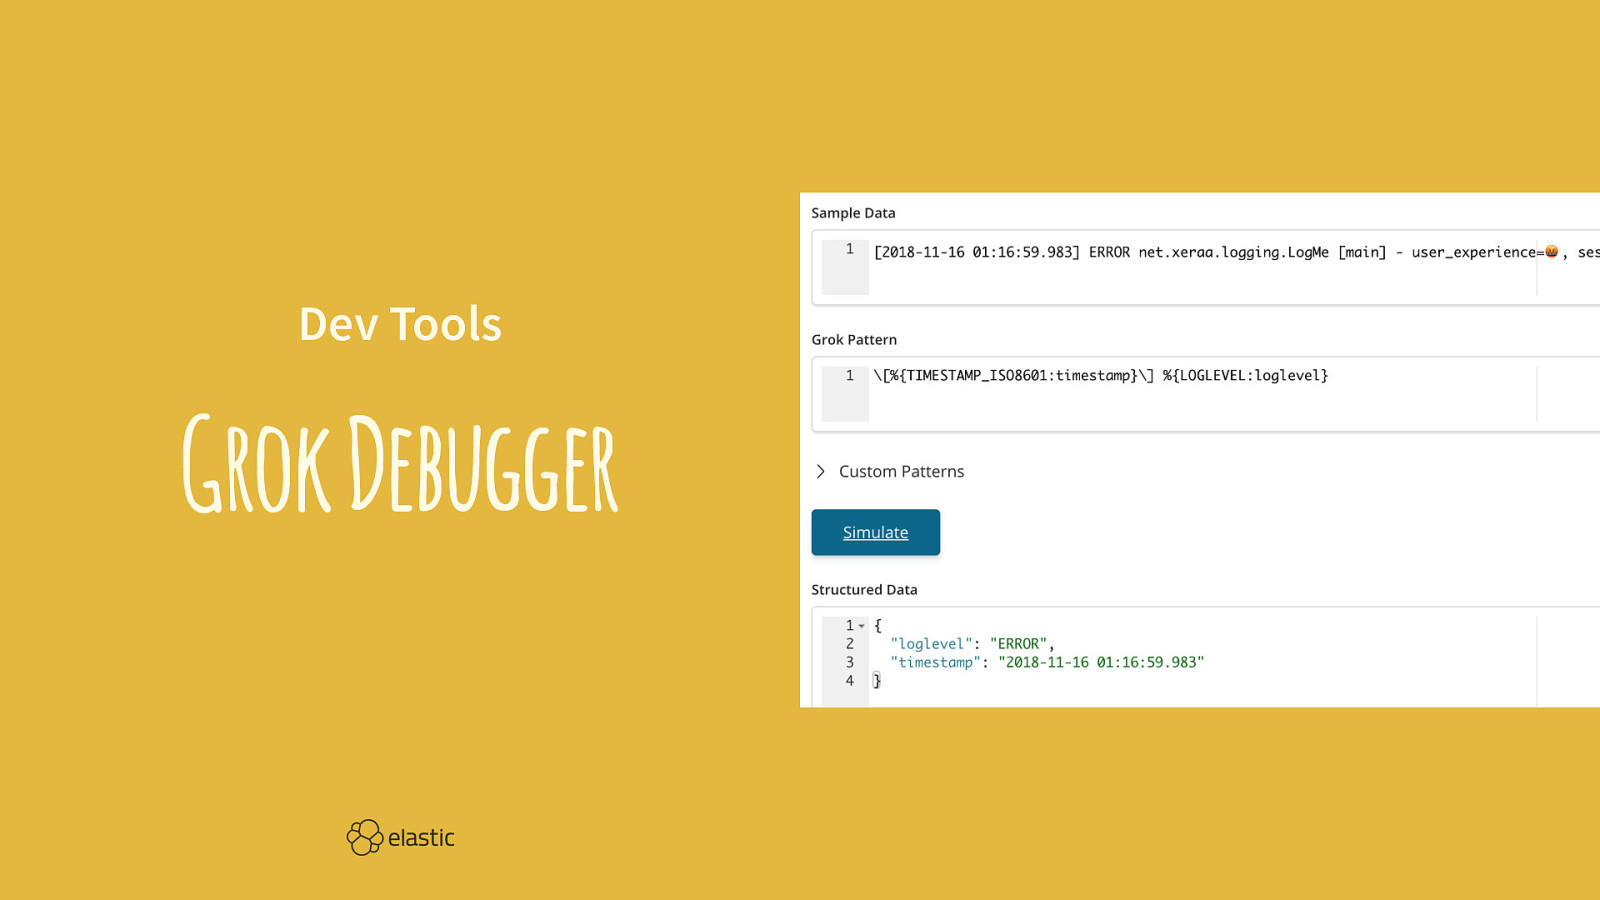
Dev Tools Grok Debugger
Slide 38
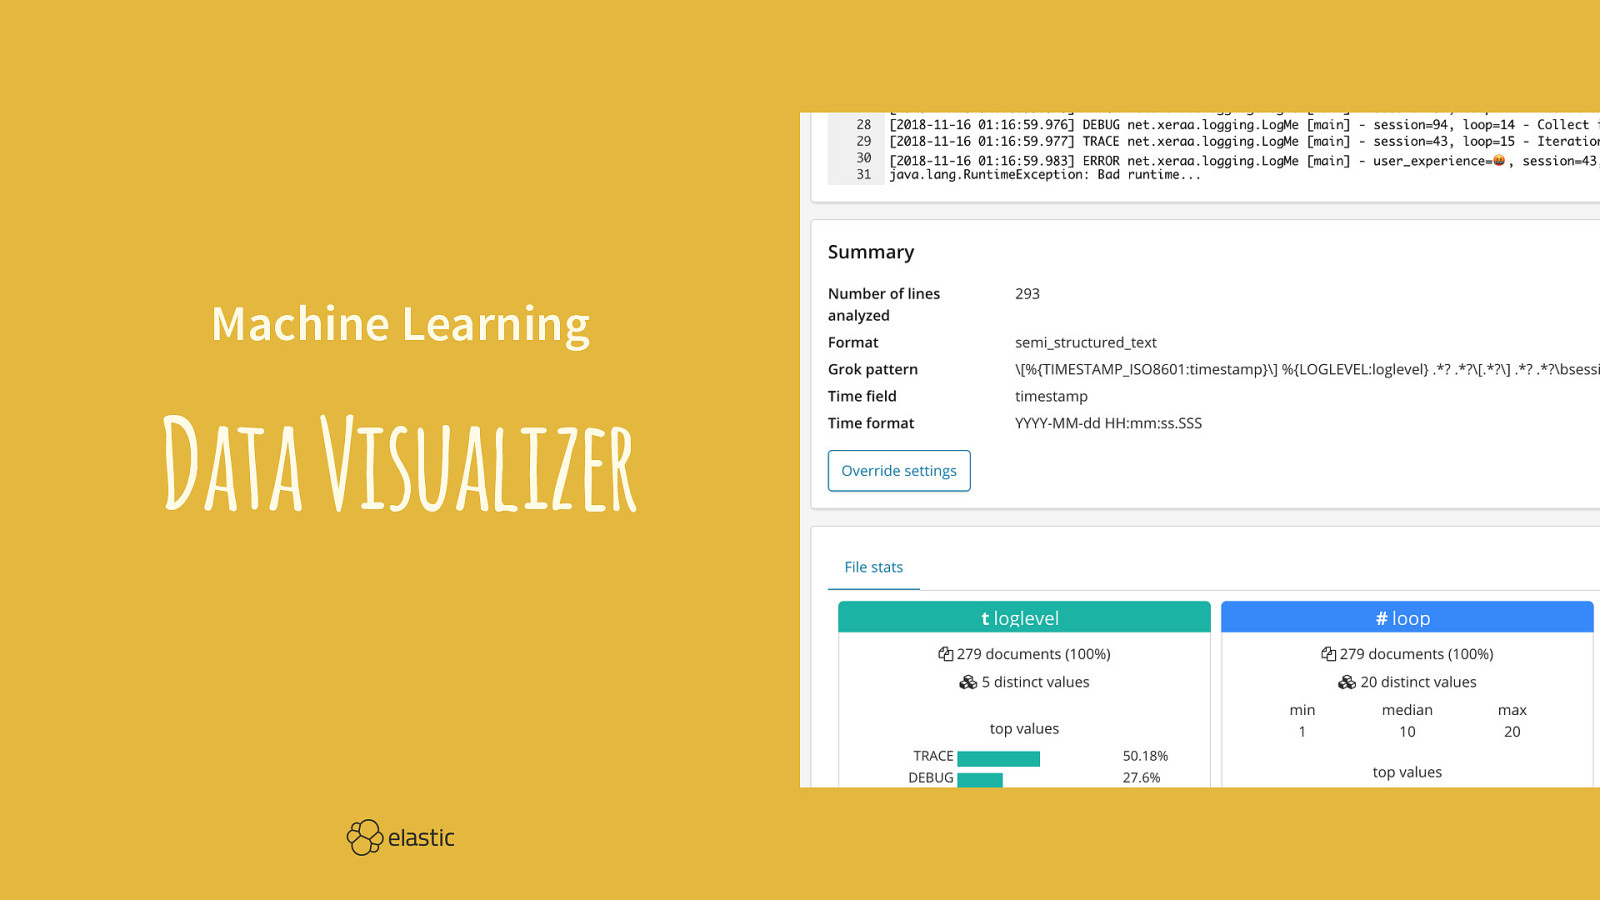
Machine Learning Data Visualizer
Slide 39

Log UI
Slide 40

Infra UI
Slide 41
Filebeat Raw events in Discover /good: MDC logging under json.name and the context view for one log message meta.* and host.* information
Slide 42
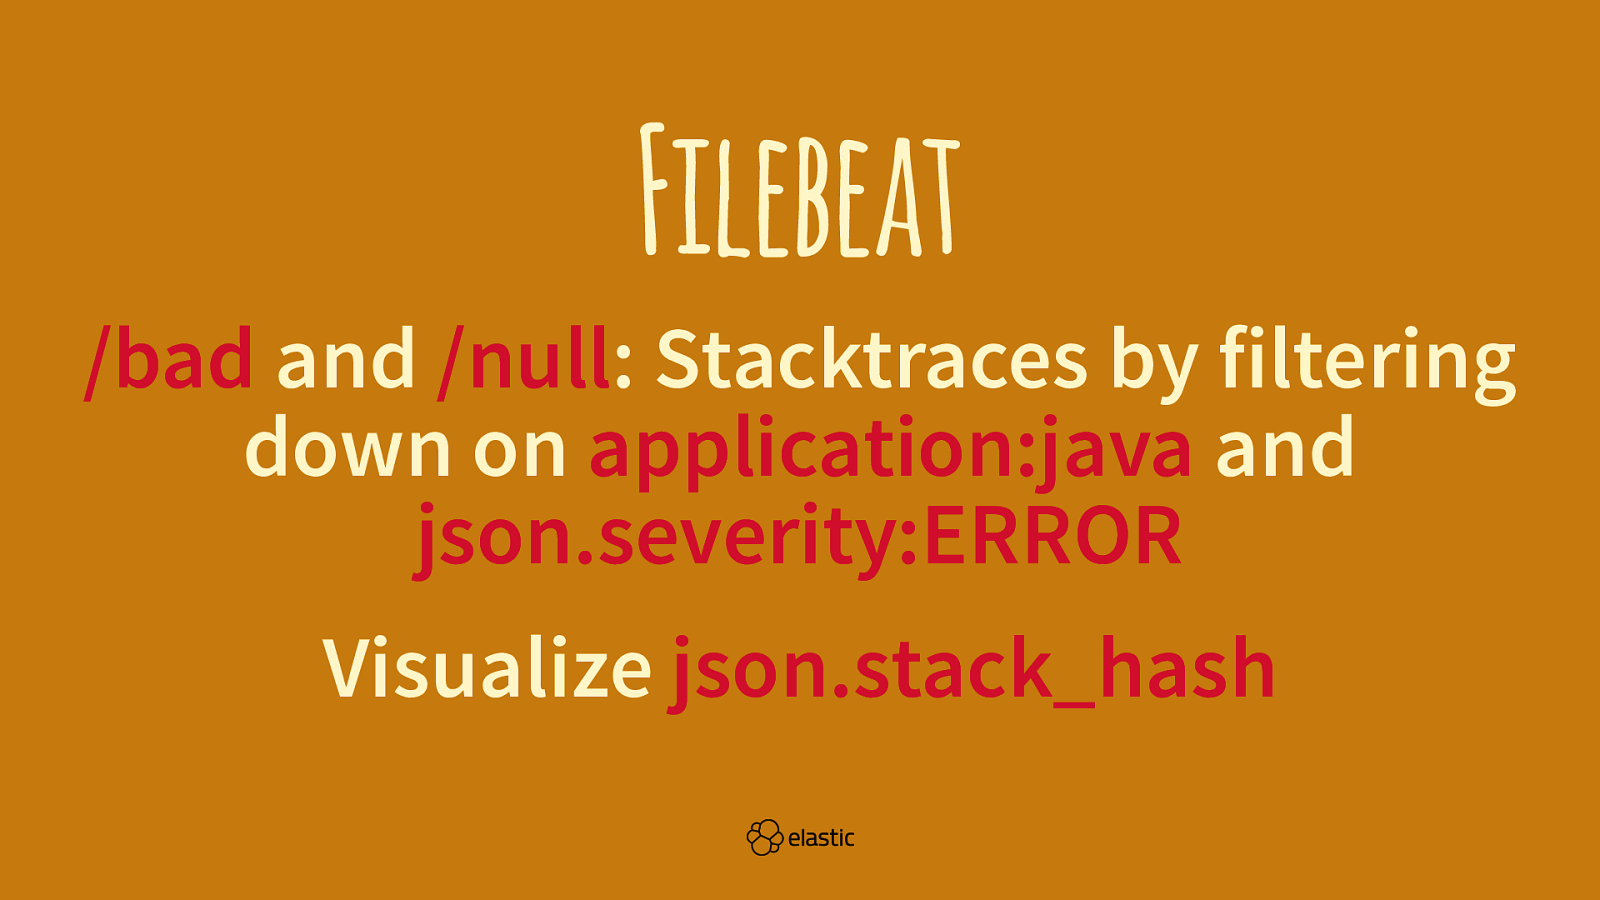
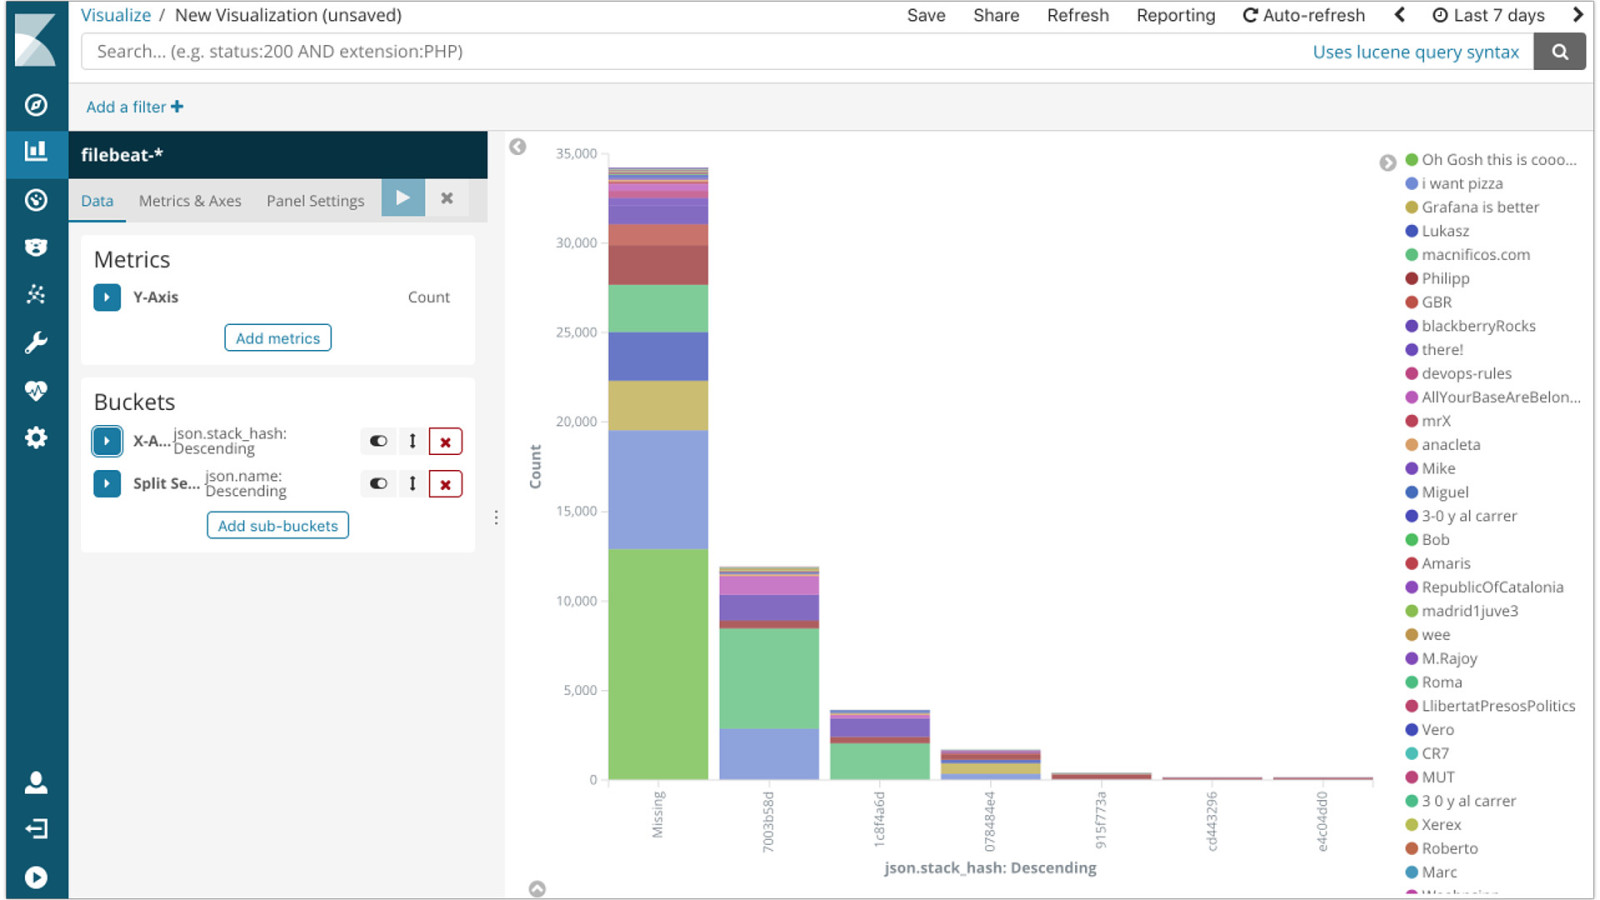
Filebeat /bad and /null: Stacktraces by filtering down on application:java and json.severity:ERROR Visualize json.stack_hash
Slide 43
Slide 44
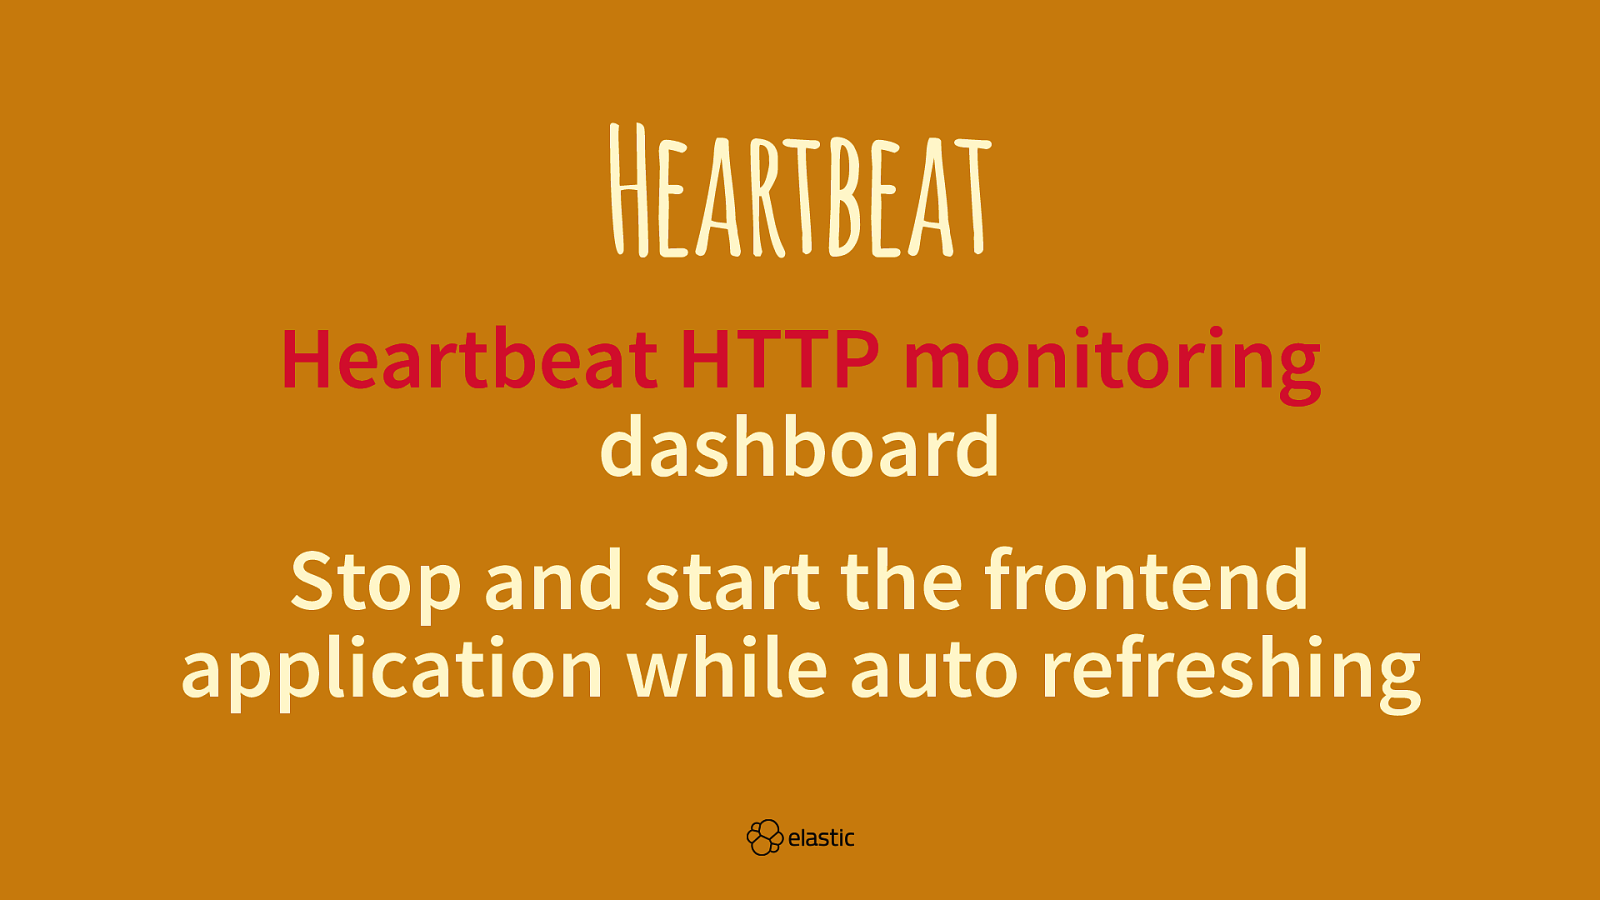
Heartbeat Heartbeat HTTP monitoring dashboard Stop and start the frontend application while auto refreshing
Slide 45
Metricbeat nginx [Metricbeat Nginx] Overview dashboard
Slide 46
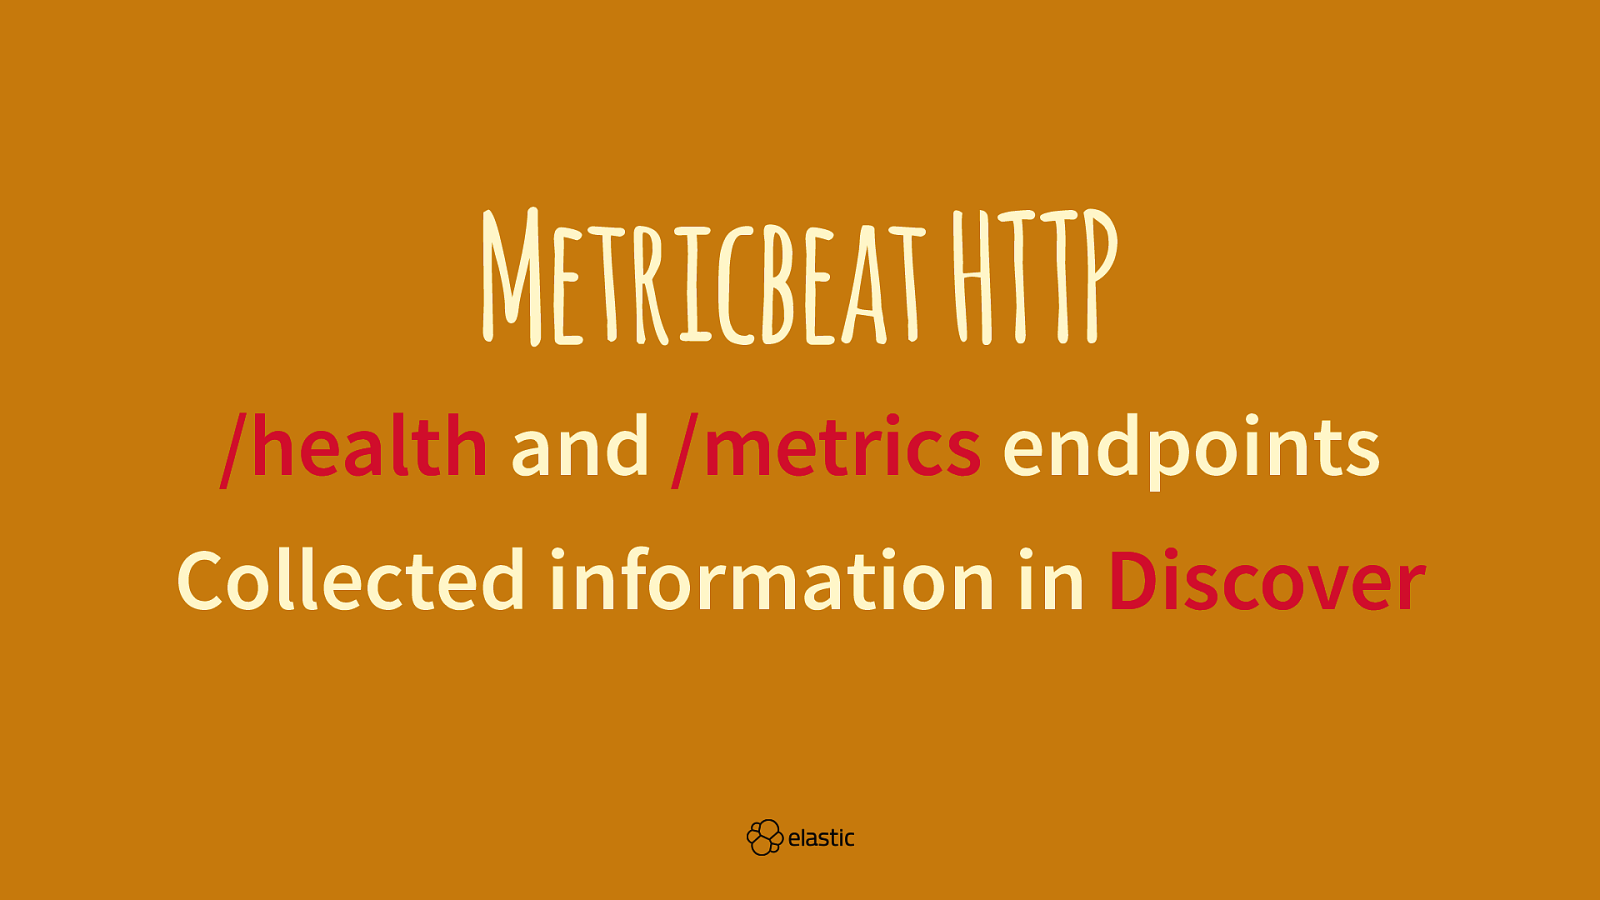
Metricbeat HTTP /health and /metrics endpoints Collected information in Discover
Slide 47
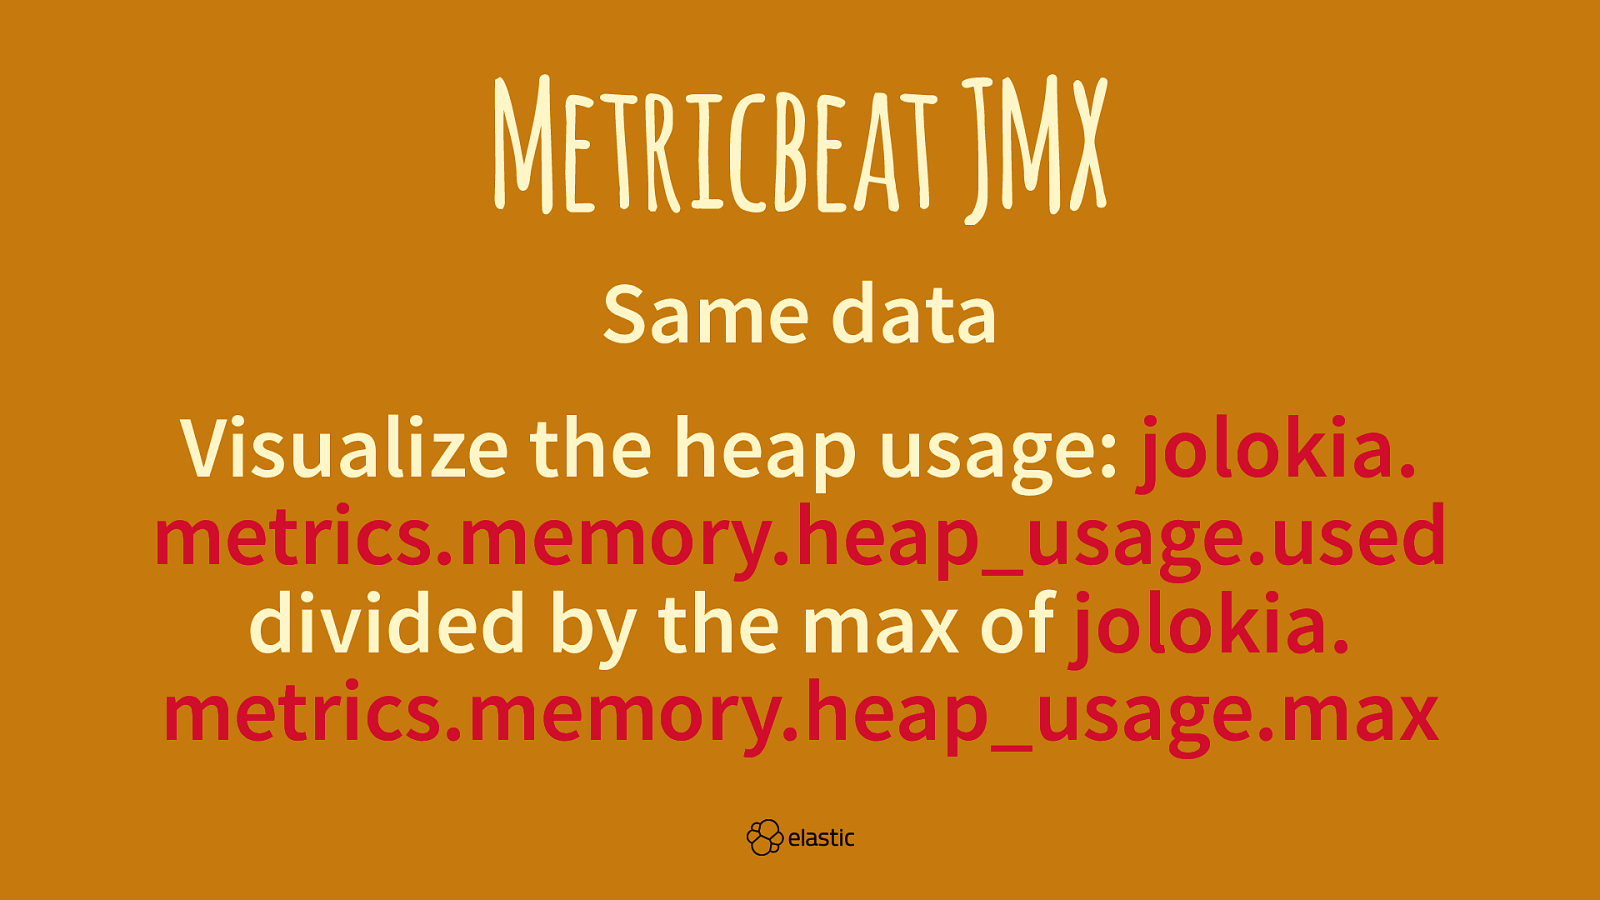
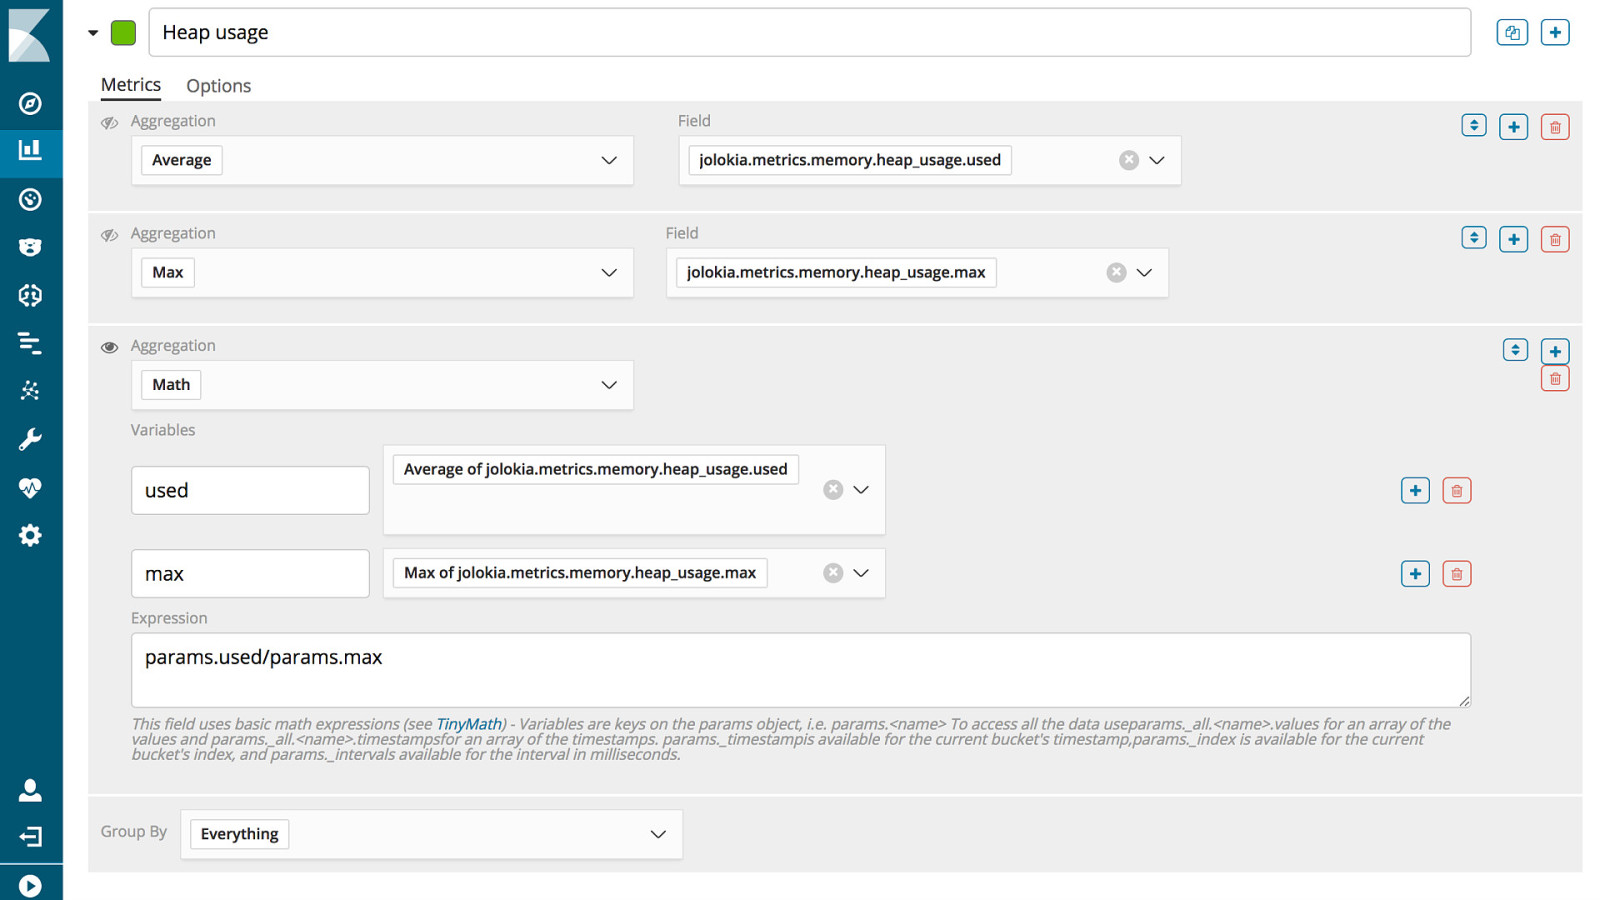
Metricbeat JMX Same data Visualize the heap usage: jolokia. metrics.memory.heap_usage.used divided by the max of jolokia. metrics.memory.heap_usage.max
Slide 48
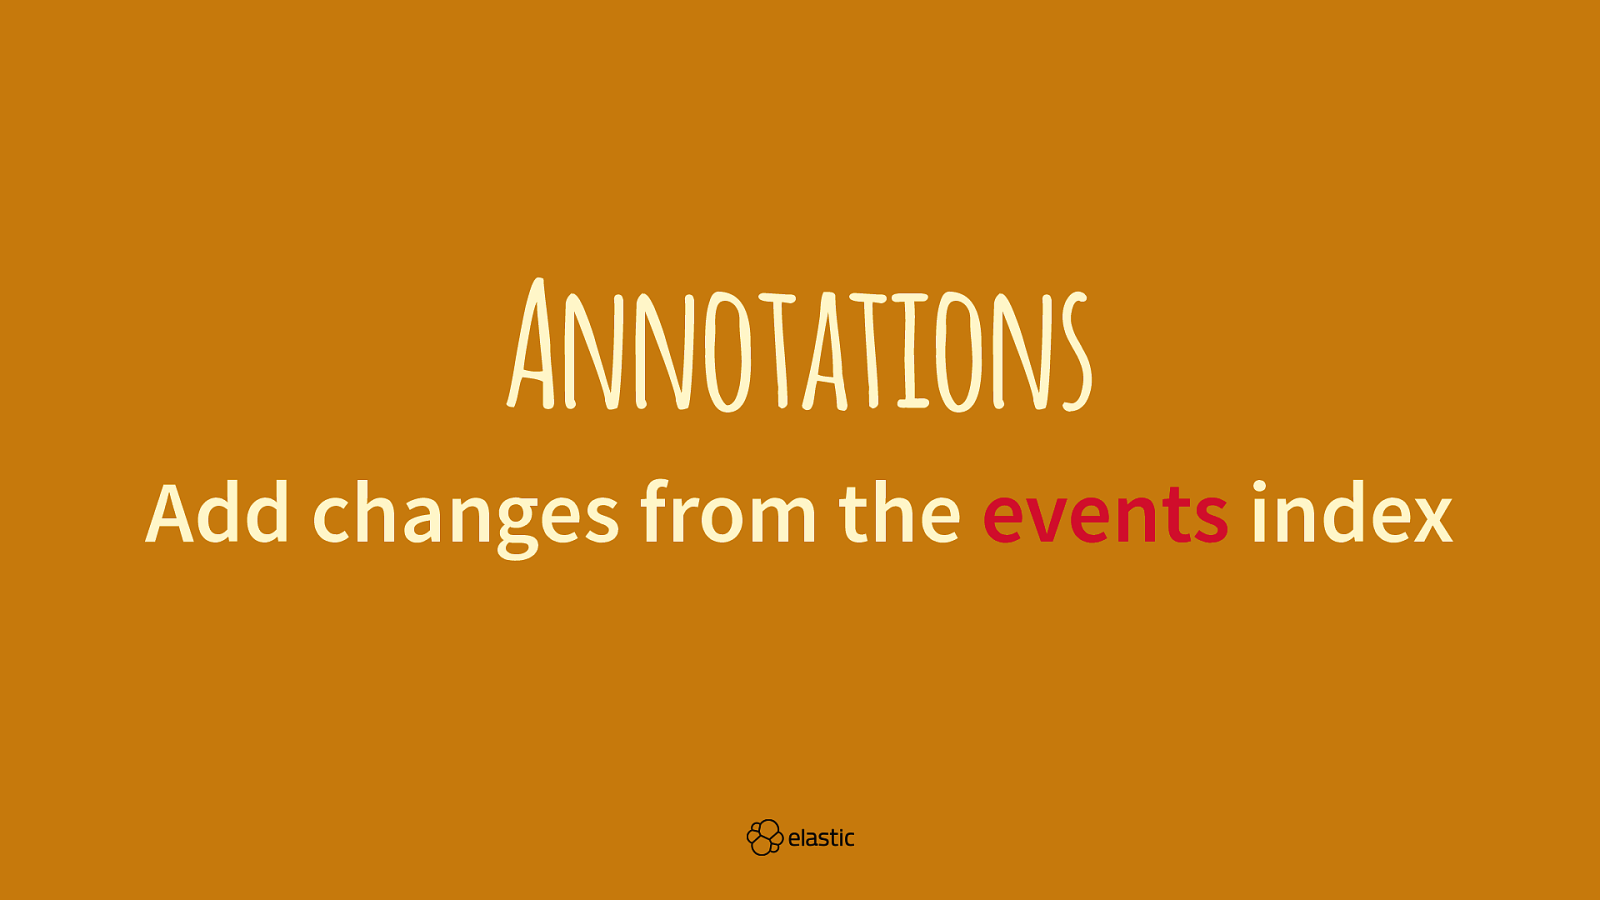
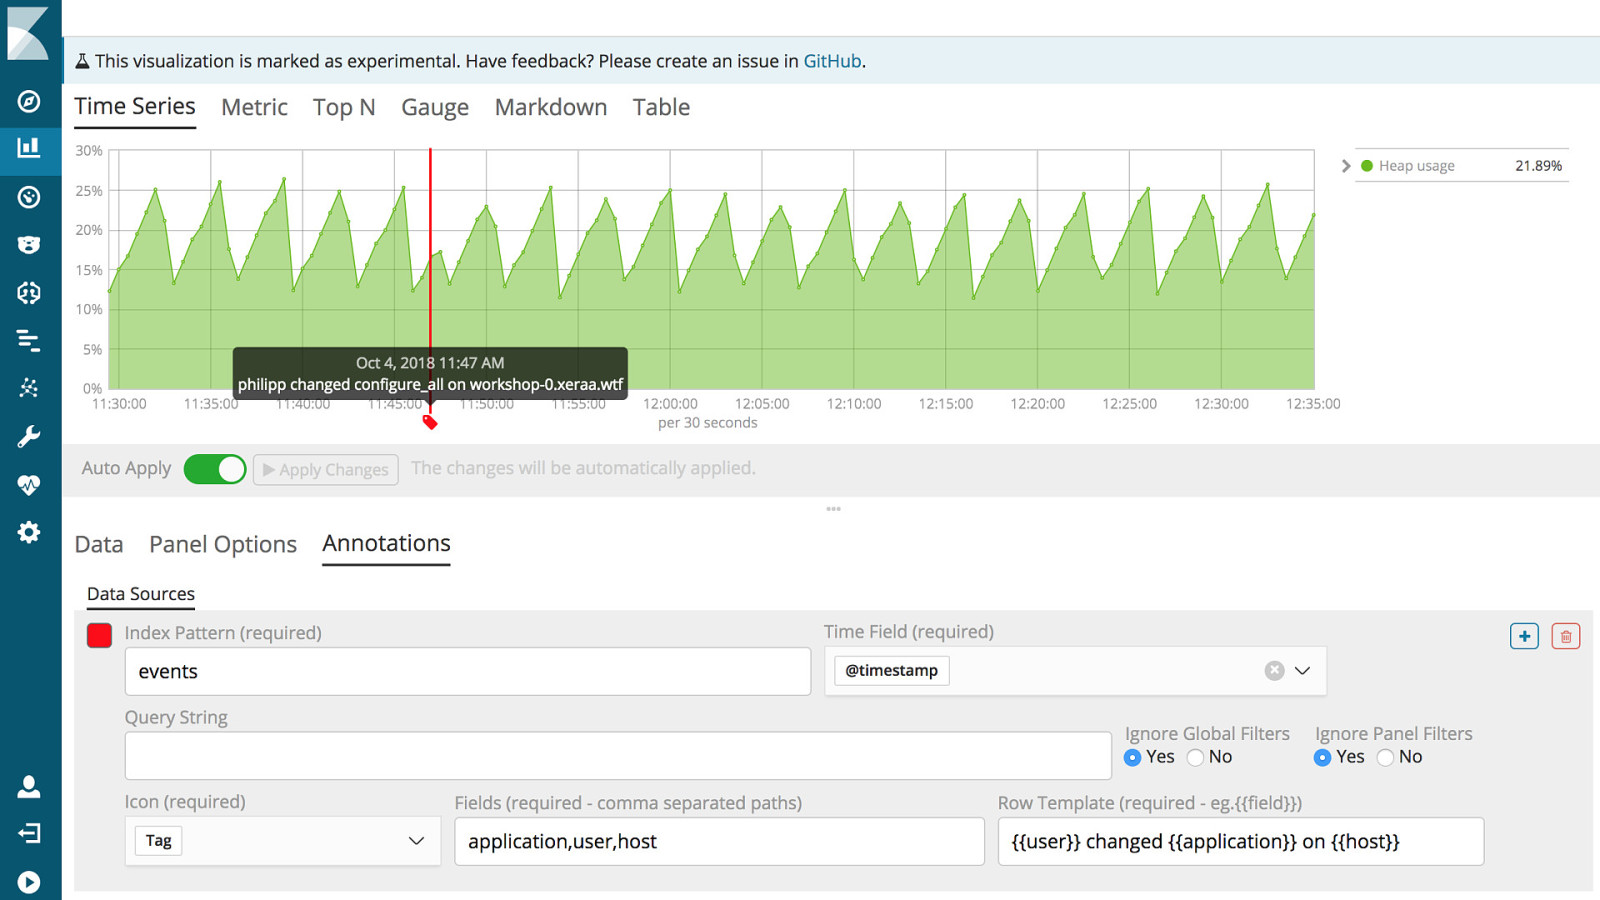
Annotations Add changes from the events index
Slide 49
Slide 50
Slide 51
APM Distributed Tracing
Slide 52

More Features
Slide 53

Slide 54

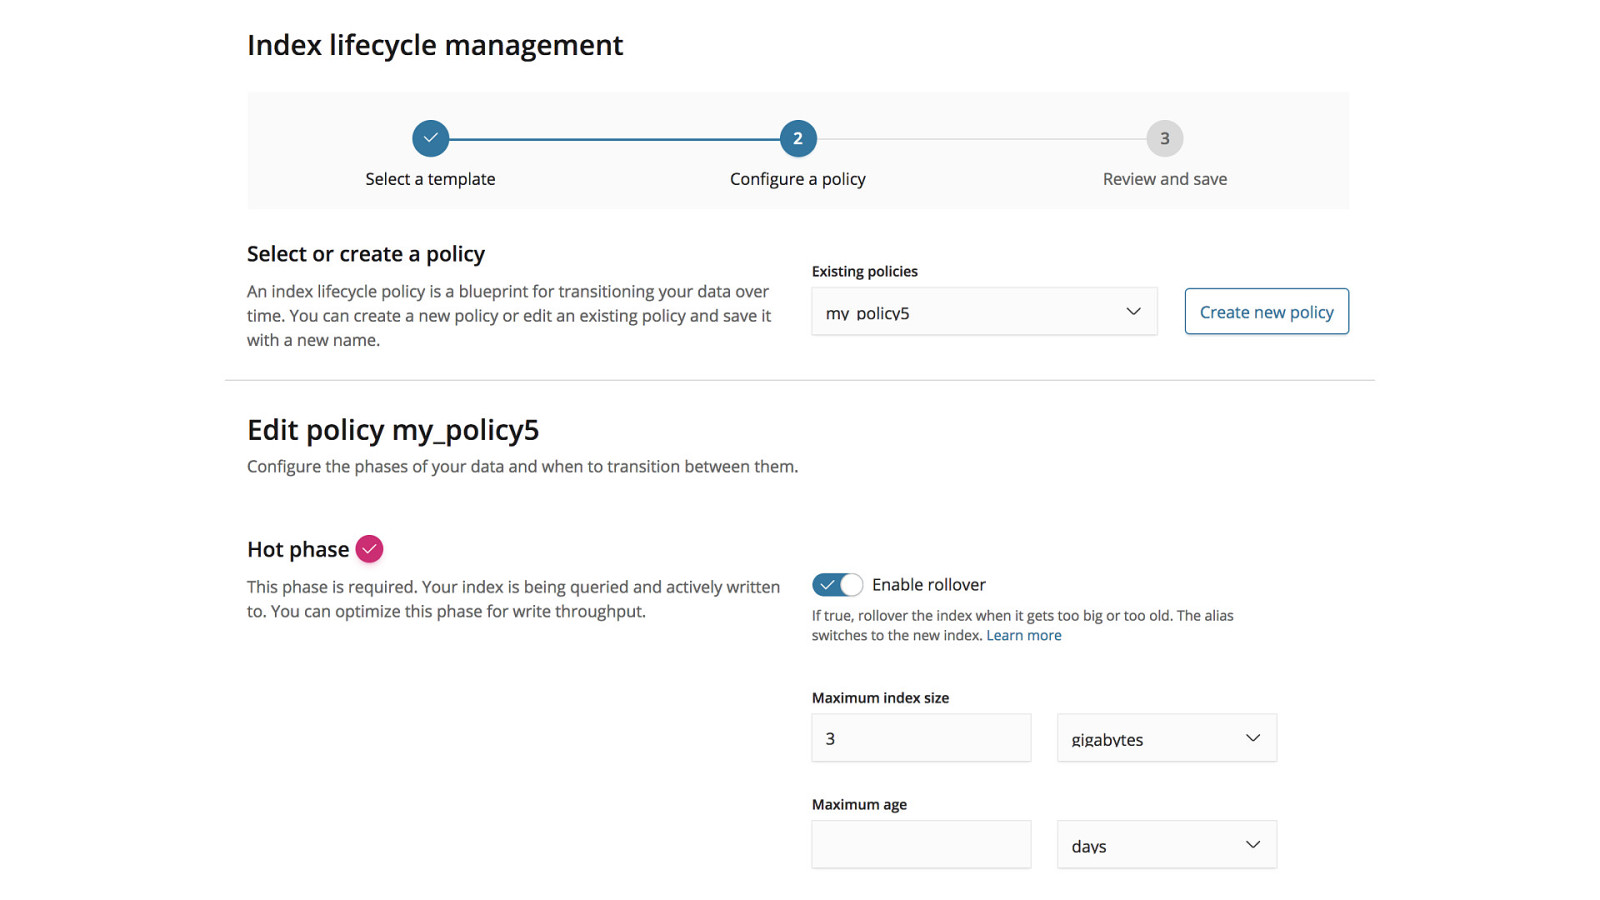
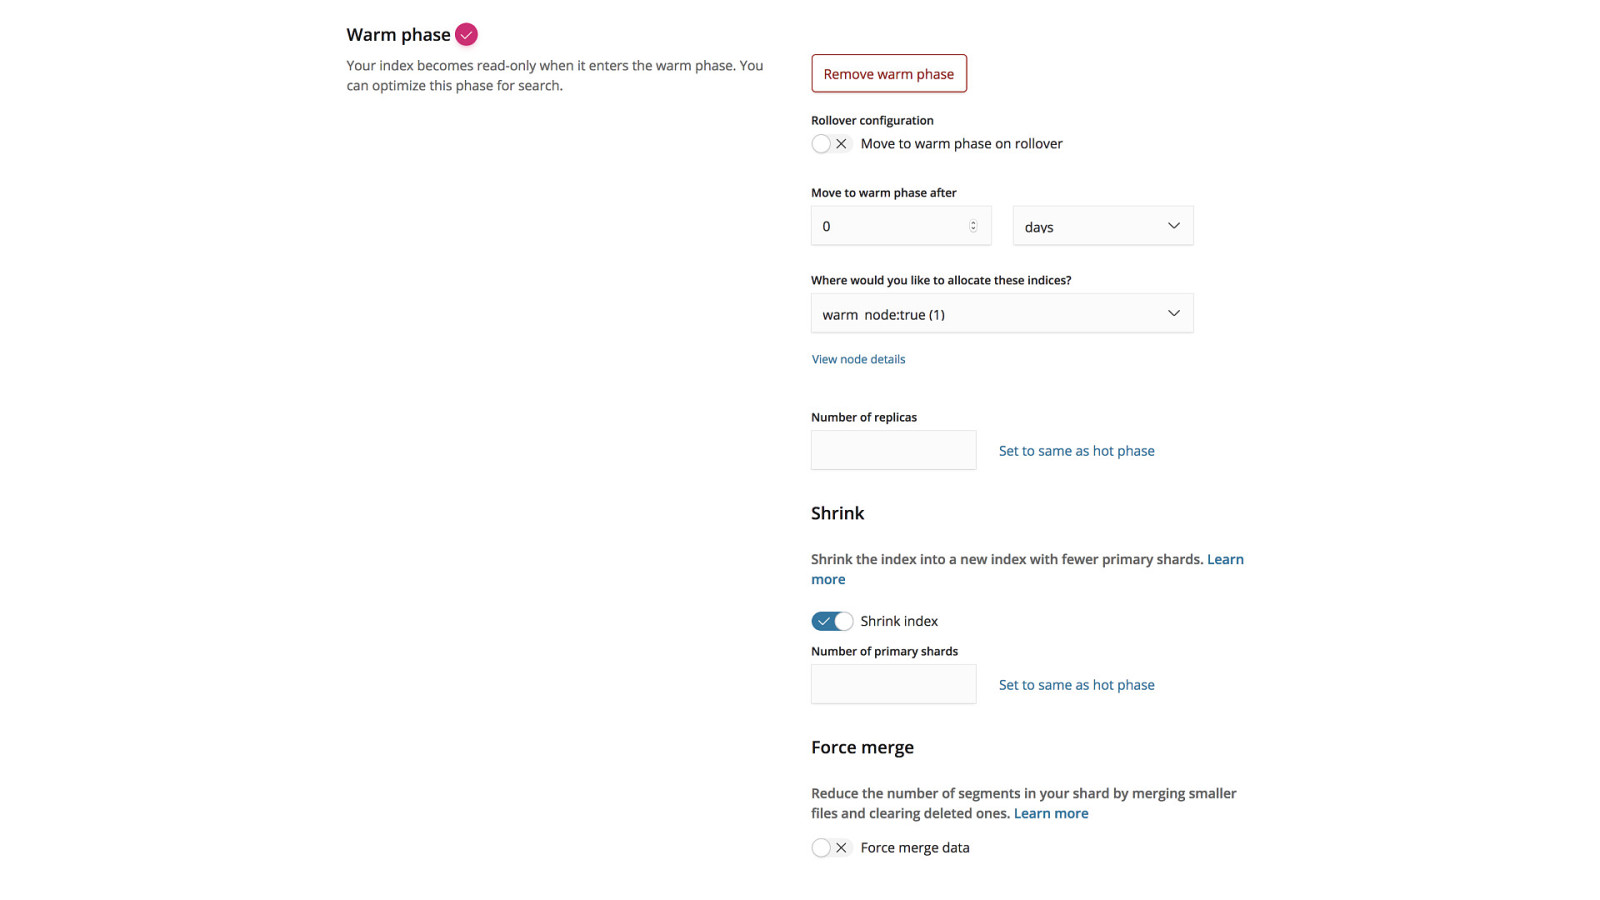
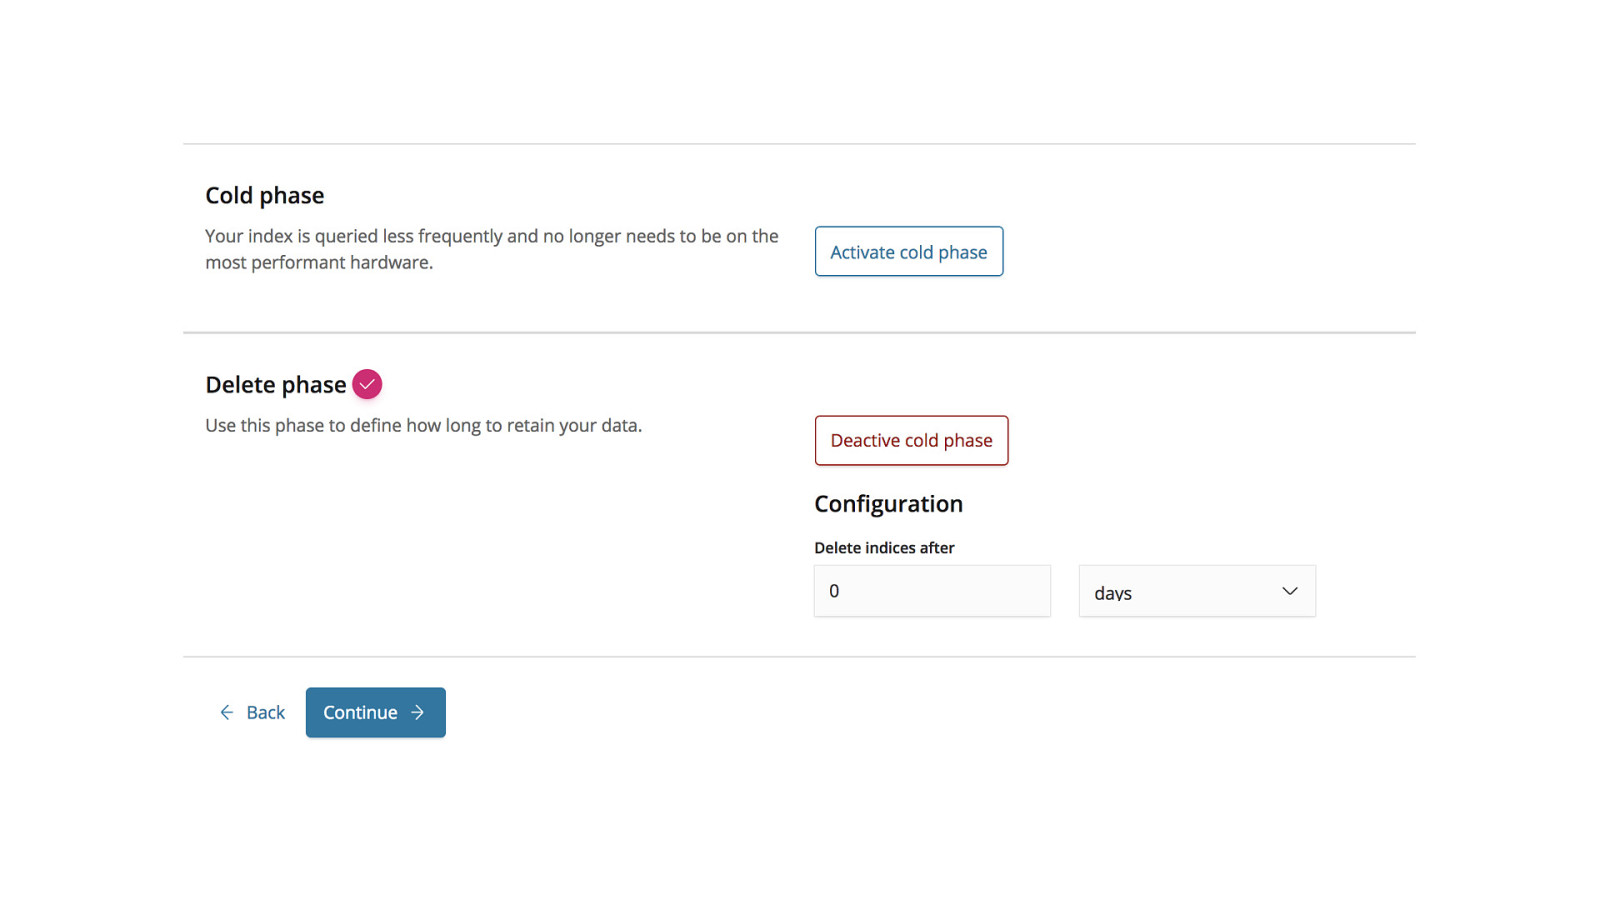
Index Lifecycle Management Currently https://github.com/elastic/curator
Slide 55
Slide 56
Slide 57
Slide 58
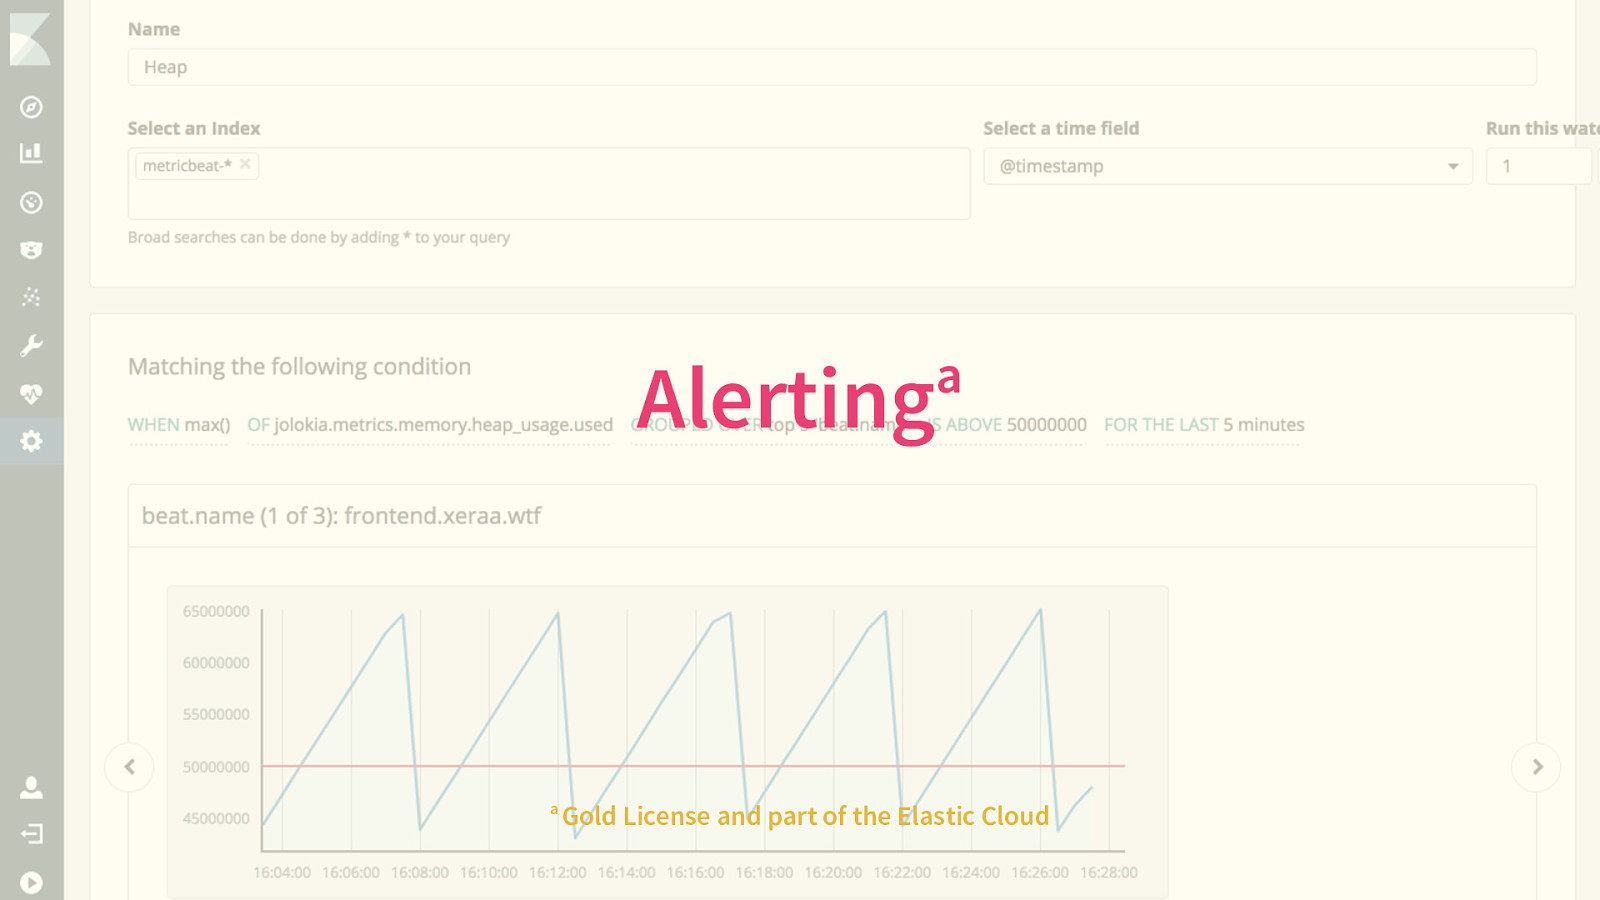
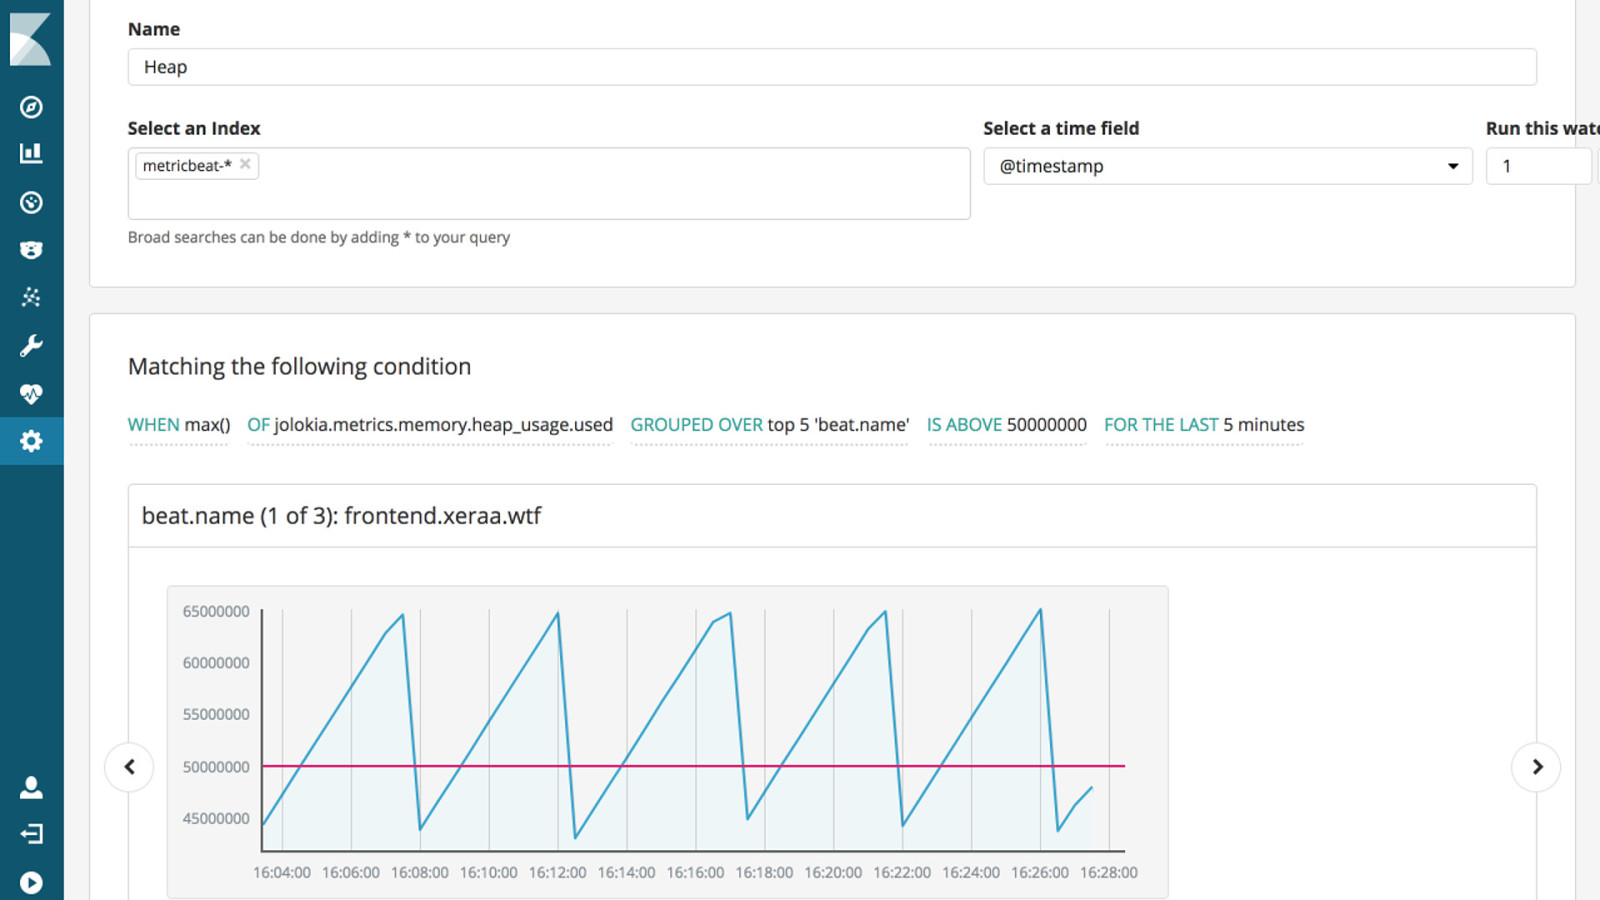
a Alerting a Gold License and part of the Elastic Cloud
Slide 59
Slide 60
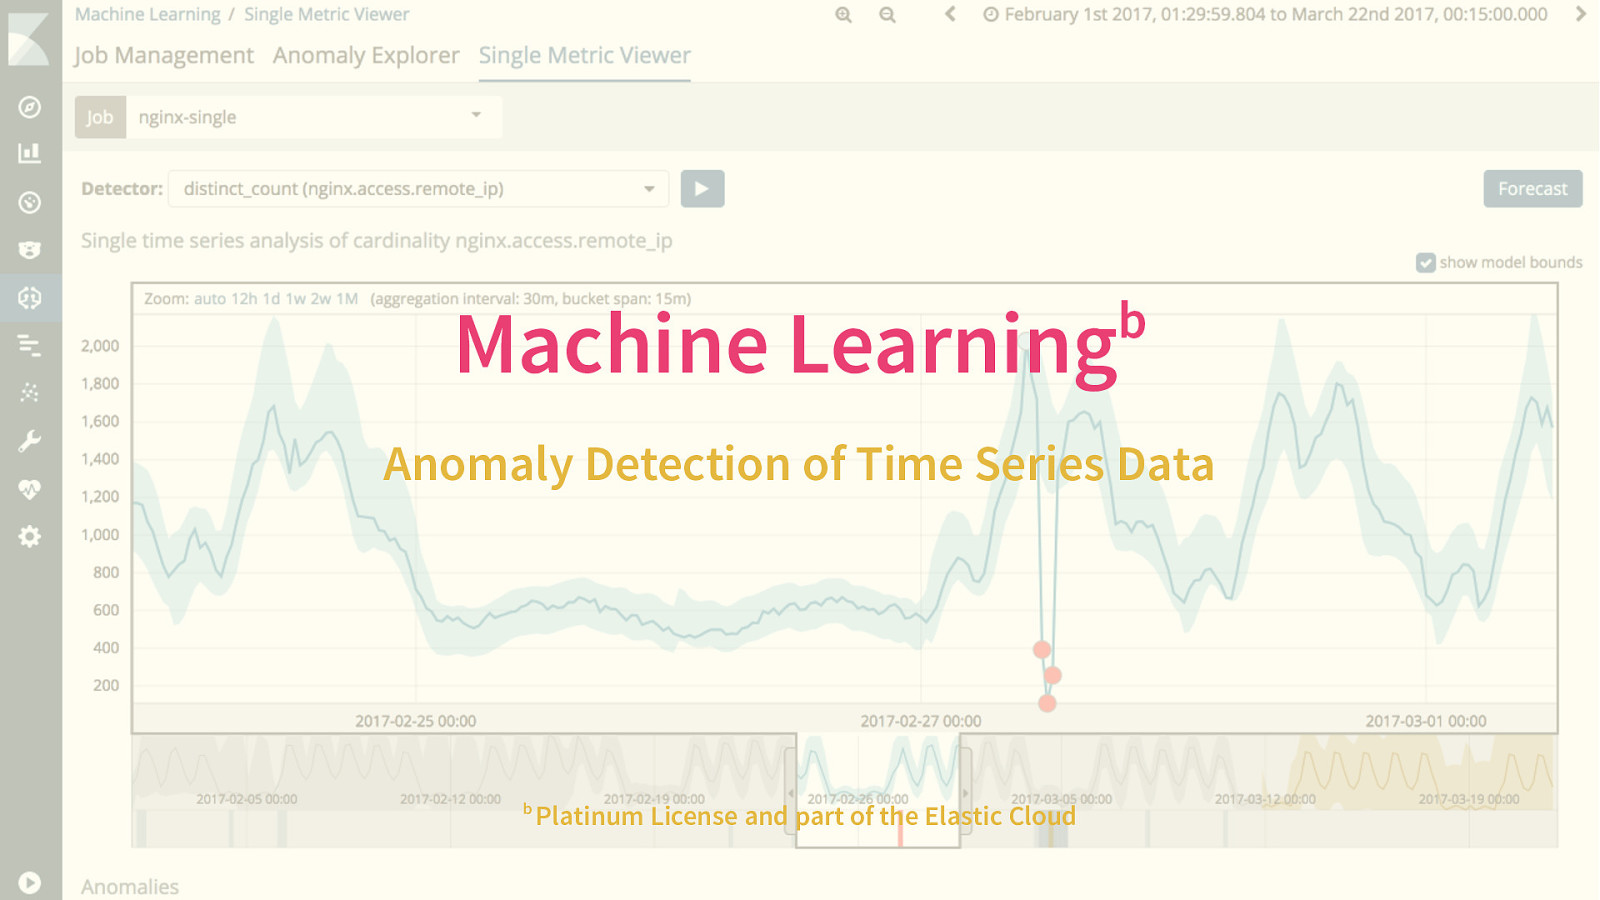
b Machine Learning Anomaly Detection of Time Series Data b Platinum License and part of the Elastic Cloud
Slide 61
Slide 62

Security c c Gold / Platinum License and part of the Elastic Cloud
Slide 63

Q&A + Your Apps
Slide 64

Conclusion
Slide 65

Slide 66
System metrics & network Filebeat modules & Auditbeat Application logs
Slide 67
Uptime Application metrics Request tracing
Slide 68

Code https://github.com/xeraa/ microservice-monitoring
Slide 69

Thank You Philipp Krenn PS: Sticker @xeraa