The Holy Trinity of Monitoring: Logs, Metrics, and Traces
A presentation at DevOpsDays Istanbul 2018 in in Istanbul, Turkey by Philipp Krenn
The Holy Trinity of Monitoring: Logs, Metrics, Traces Philipp Krenn @xeraa


Developer
Disclaimer I build highly monitored Hello World apps

Code https://github.com/xeraa/microservice-monitoring

Application
Simple No discovery, load-balancing,...


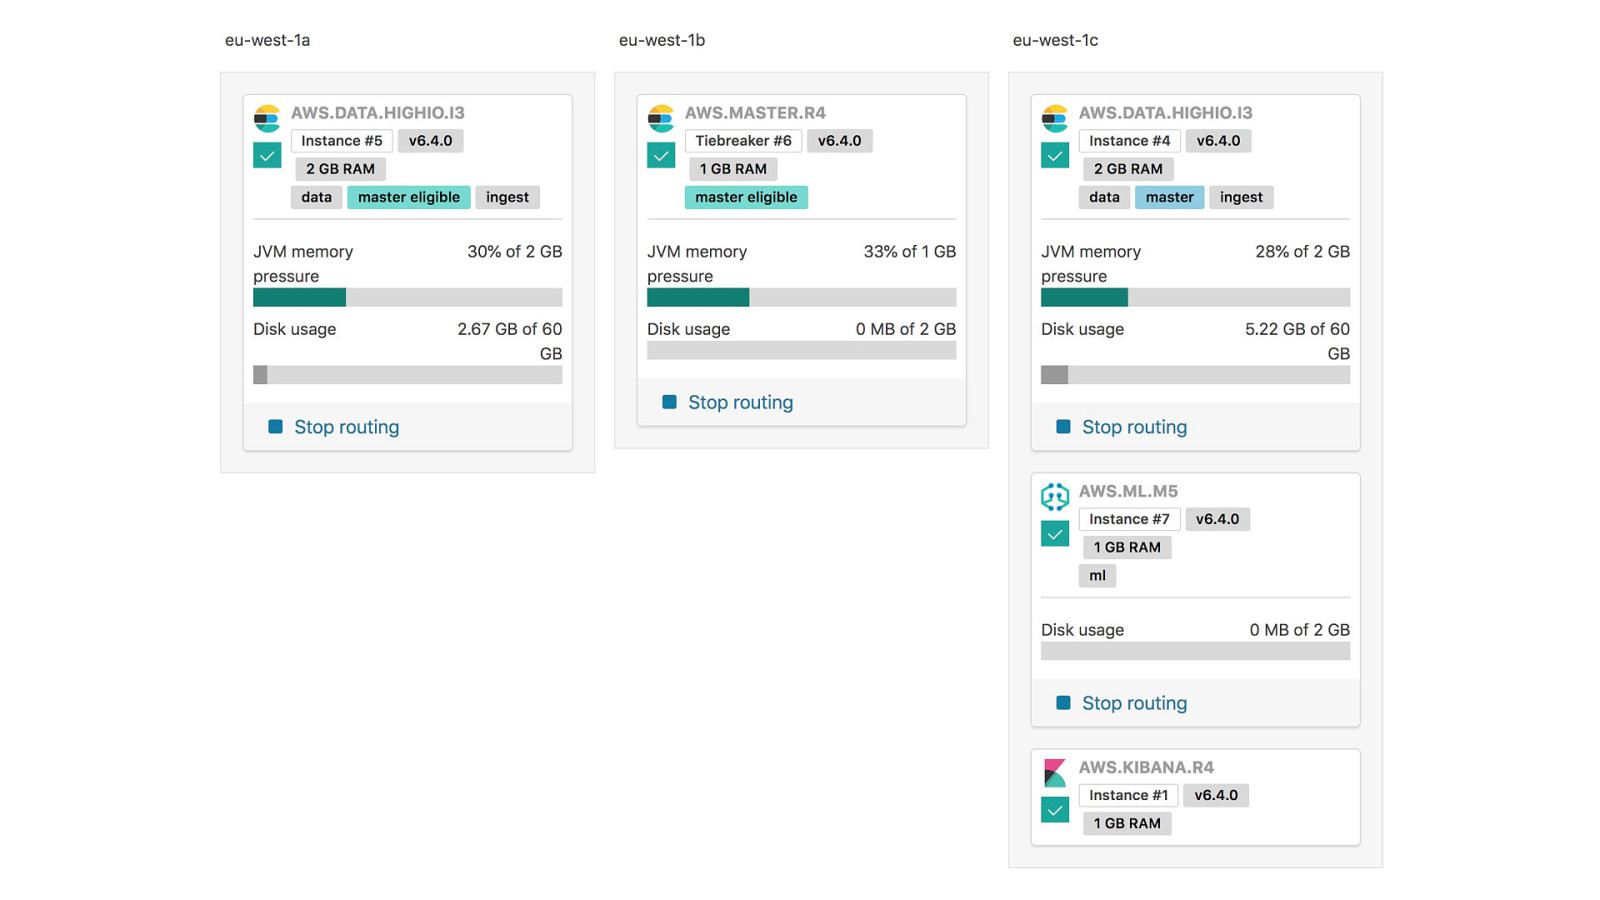
Cloud


Open Source
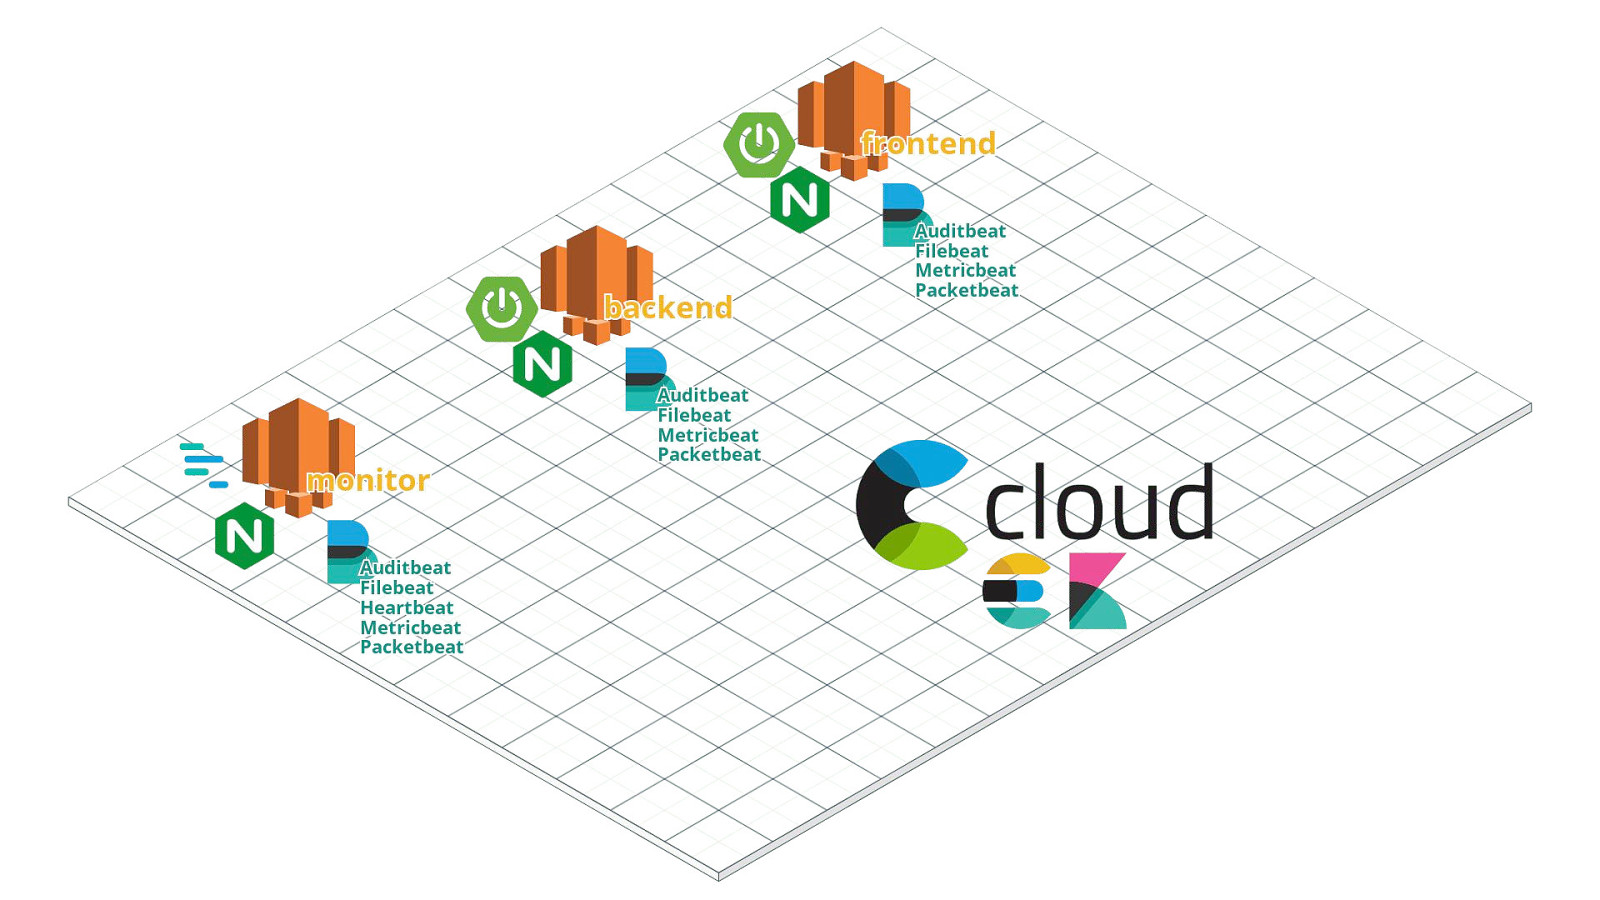
Monitoring
Metricbeat: System

Packetbeat

https://xeraa.wtf

Metricbeat: nginx

Filebeat Modules
Filebeat + JSON MDC, context, stack hash

Heartbeat
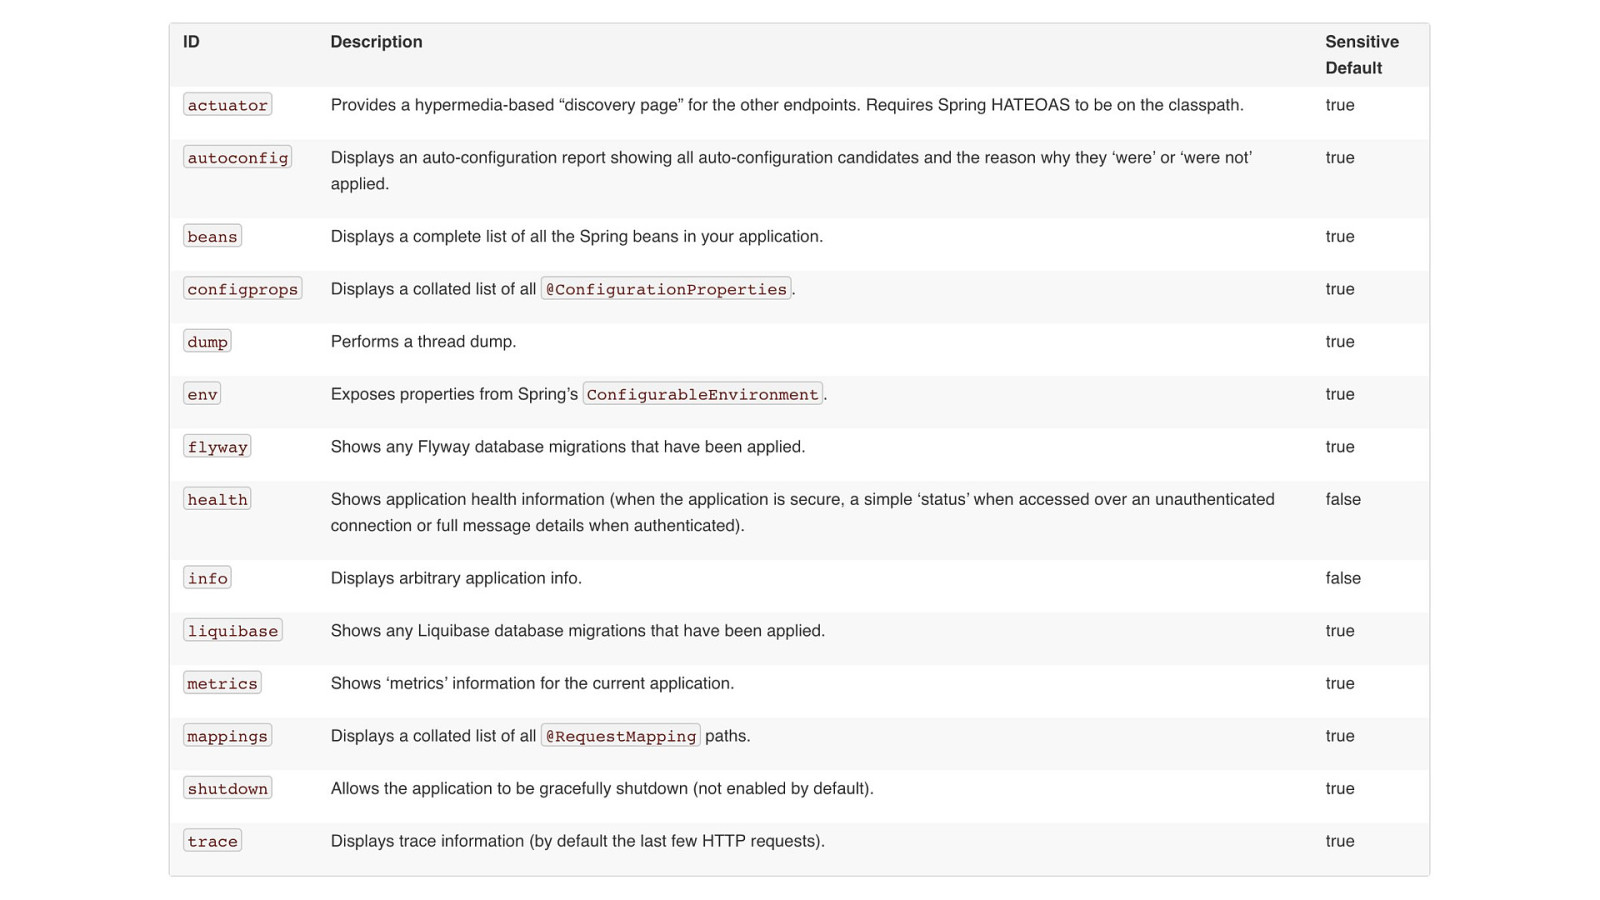
Metricbeat: HTTP

Metricbeat: Jolokia

Time Series Visual Builder & Annotations
Auditbeat
APM Application Performance Management / Monitoring

More
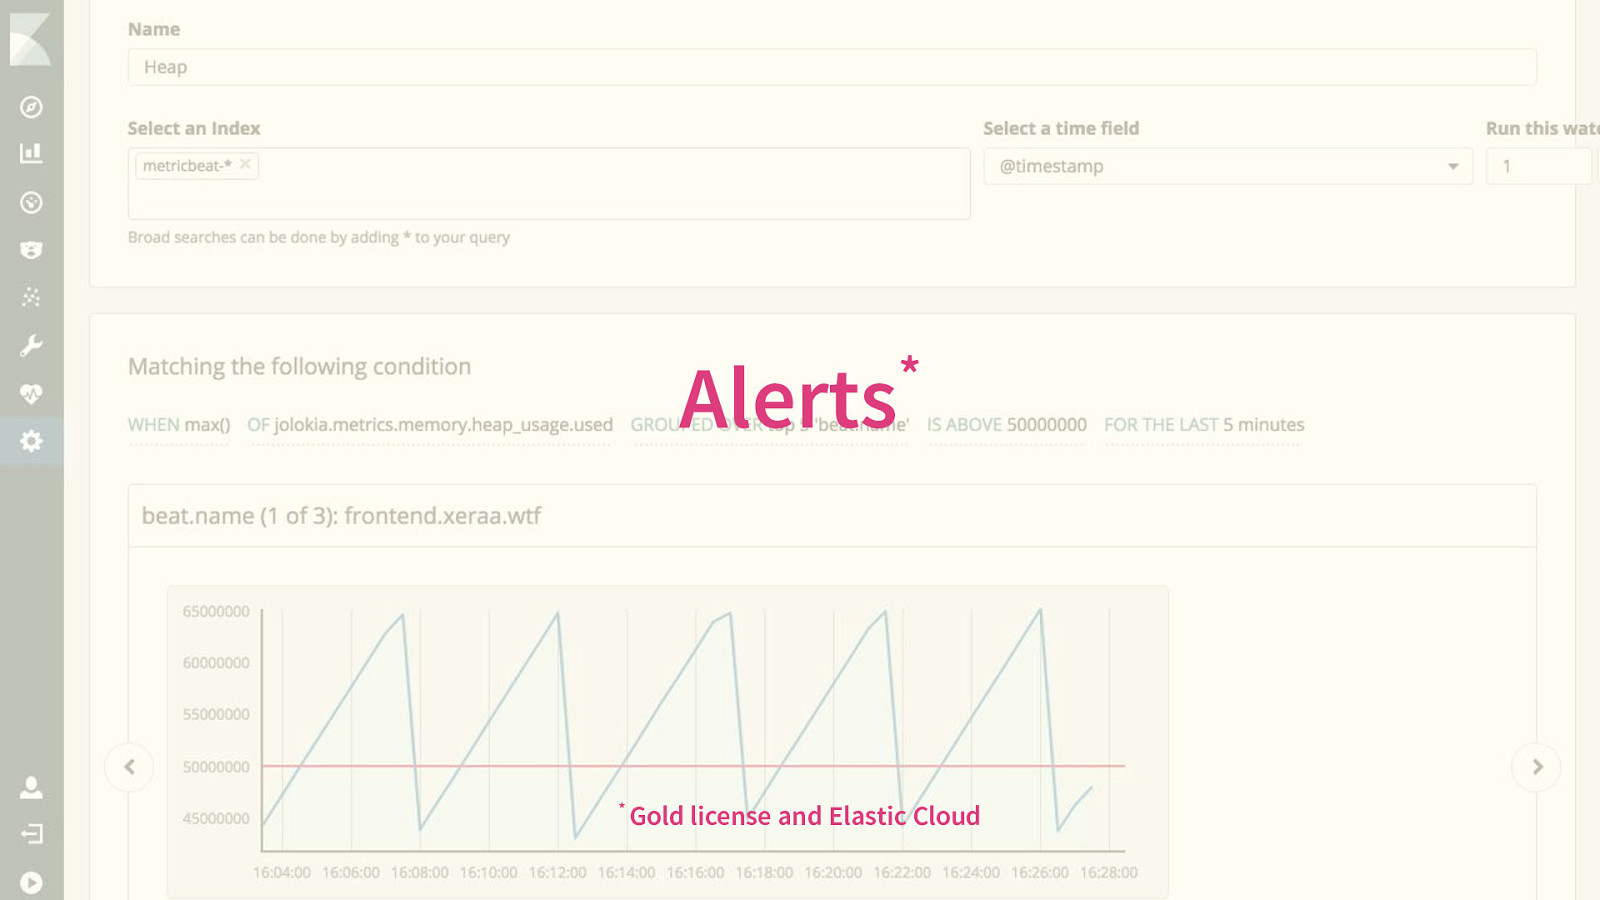
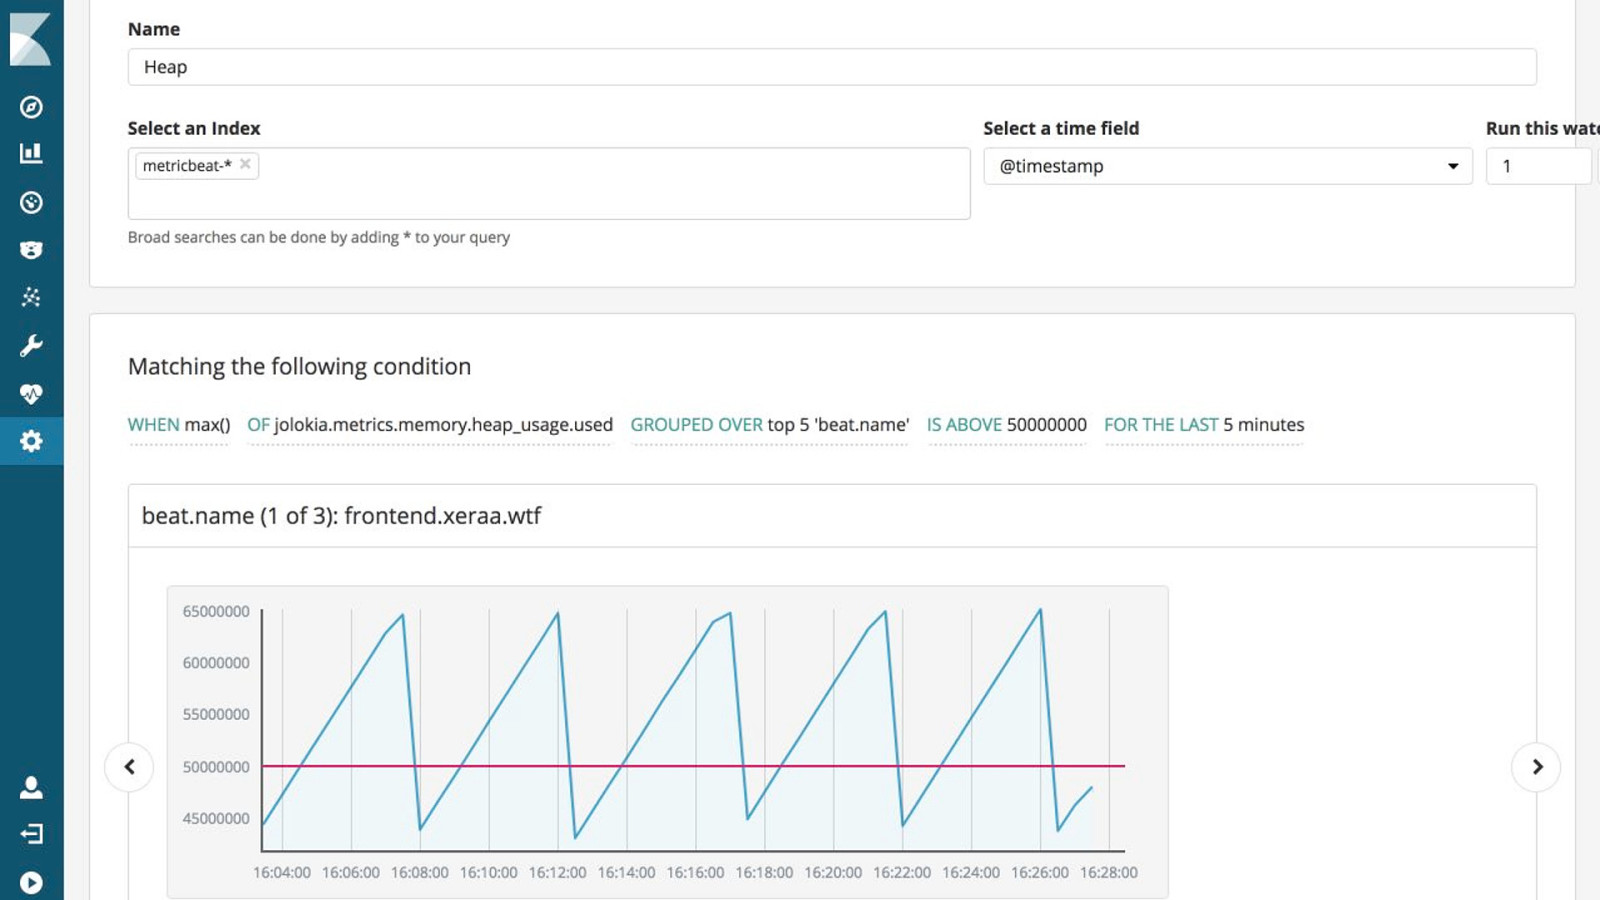
Alerts * Gold license and Elastic Cloud
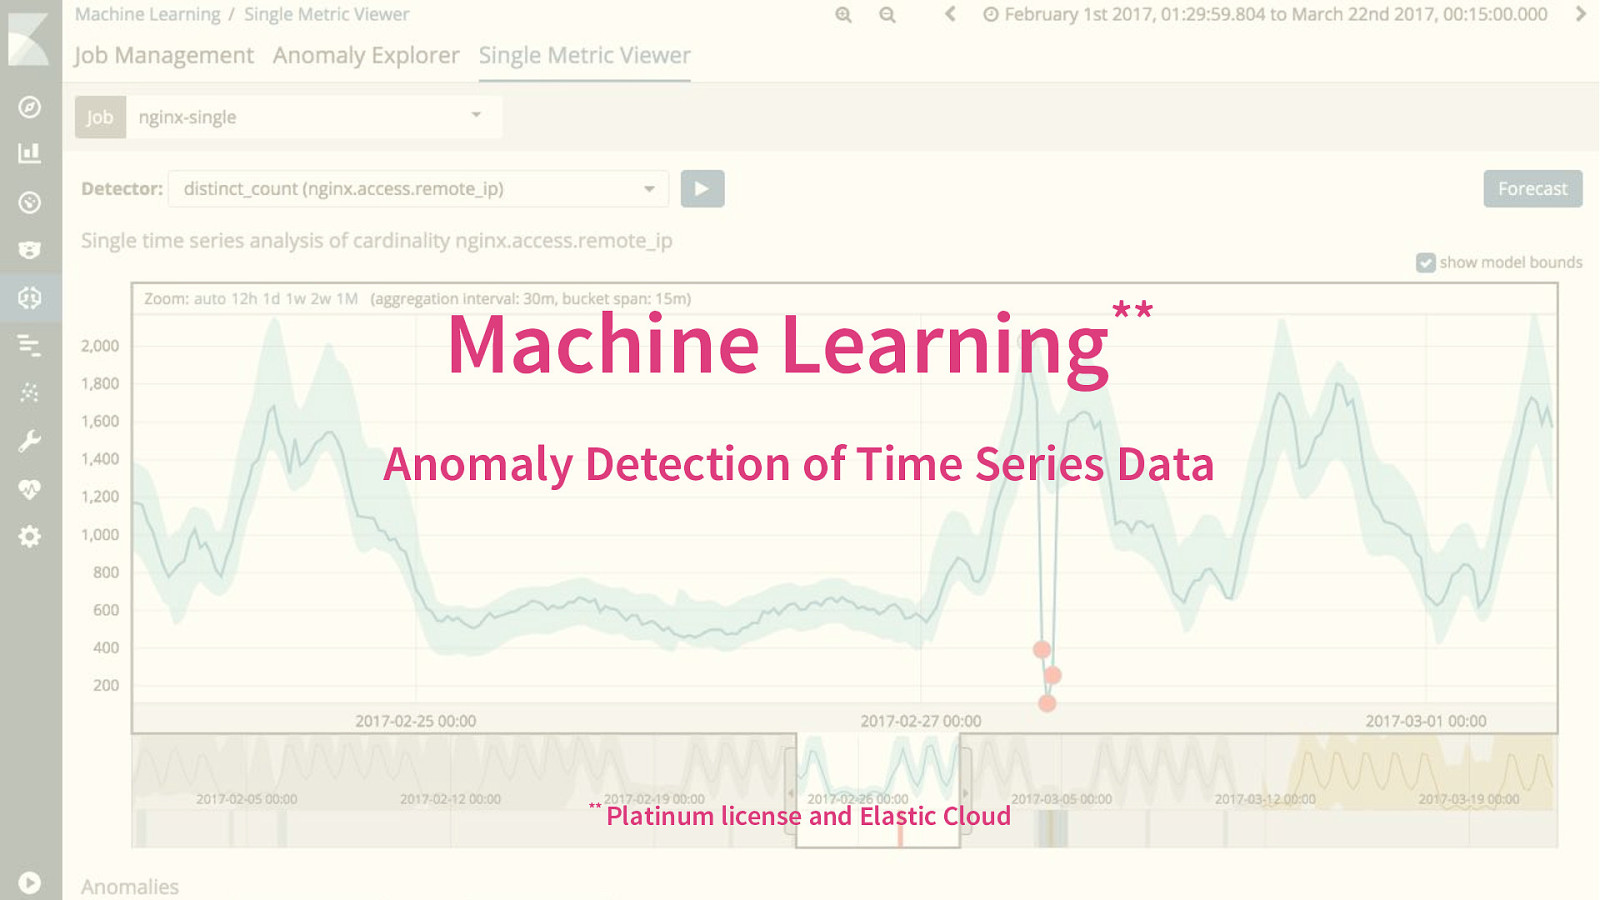
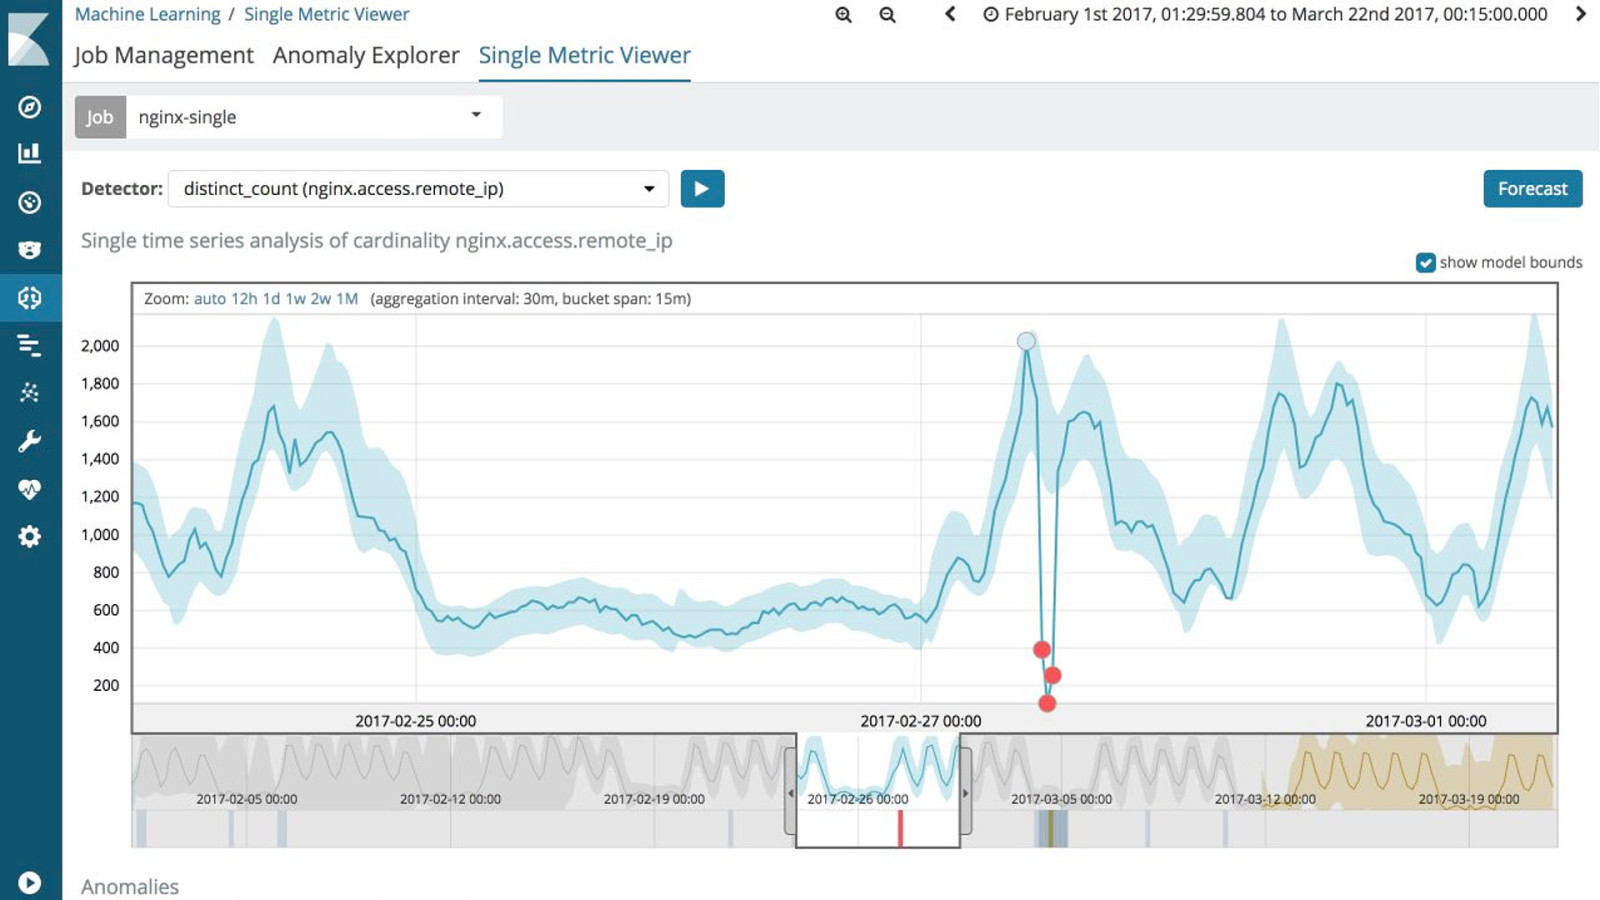
** Machine Learning Anomaly Detection of Time Series Data ** Platinum license and Elastic Cloud

Conclusion

System metrics & network Filebeat modules & Auditbeat Application logs
Uptime Application metrics Request tracing

Next https://dashboard.xeraa.wtf https://github.com/xeraa/microservice-monitoring
Questions? Philipp Krenn PS: Sticker @xeraa

"With microservices every outage is like a murder mystery" is a common complaint. But it doesn’t have to be! This talk gives an overview on how to monitor applications from every possible angle. We dive into:
- System metrics: Keep track of network traffic and system load.
- Application logs: Collect structured logs in a central location.
- Uptime monitoring: Ping services and actively monitor their availability and response time.
- Application metrics: Get the information from REST or JMX.
- Request tracing: Trace requests through a distributed system and Kibana to show how long each call takes.
And we will do all of that live, since it is so easy and much more interactive that way.
 for free. You
can too.
for free. You
can too.
Video
Resources
The following resources were mentioned during the presentation or are useful additional information.
-
GitHub: Demo Code
Monitor your Spring Boot application with the Elastic Stack all around
Buzz and feedback
Here’s what was said about this presentation on social media.