Monitor Your Applications with Logs, Metrics, Pings, and Traces Philipp Krenn @xeraa
Slide 1

Slide 2

Slide 3

Slide 4

Slide 5

Slide 6

How? vs !
Slide 7

Developer
Slide 8

Disclaimer I build highly monitored Hello World apps
Slide 9

Disclaimer This is not a training https://training.elastic.co
Slide 10

Slide 11

Slide 12

Slide 13

Slide 14
Slide 15

Slide 16

Slide 17

Slide 18

Slide 19

Slide 20

Licensing Open Source Apache-2.0 Basic free Commercial
Slide 21
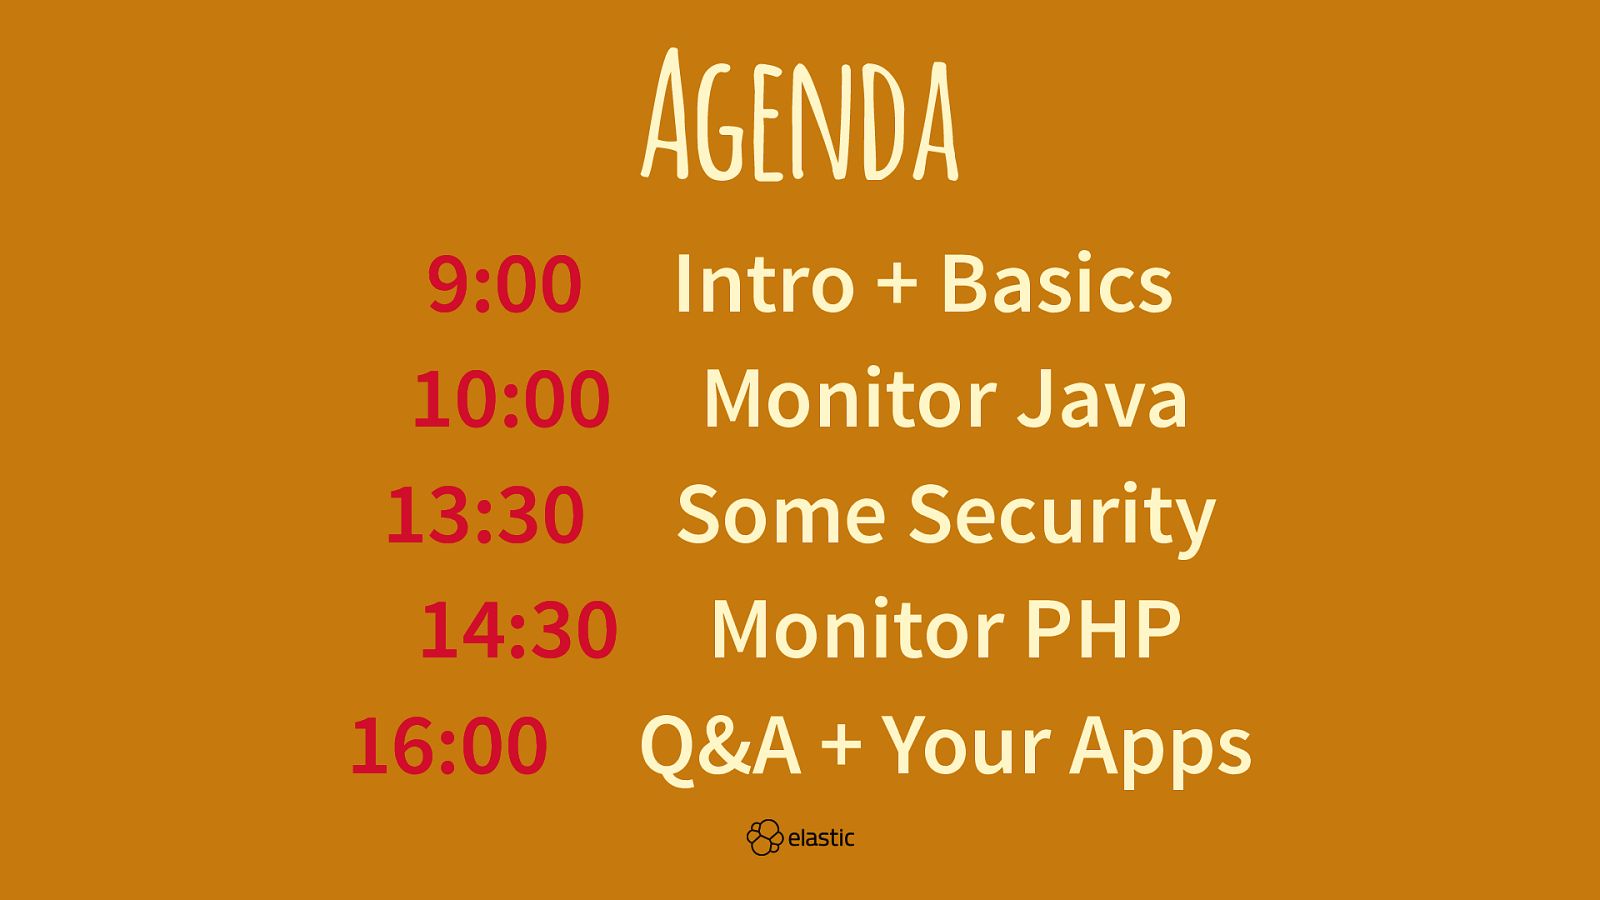
Agenda 9:00 Intro + Basics 10:00 Monitor Java 13:30 Some Security 14:30 Monitor PHP 16:00 Q&A + Your Apps
Slide 22

Intro + Basics
Slide 23

Intro Experience Goals
Slide 24

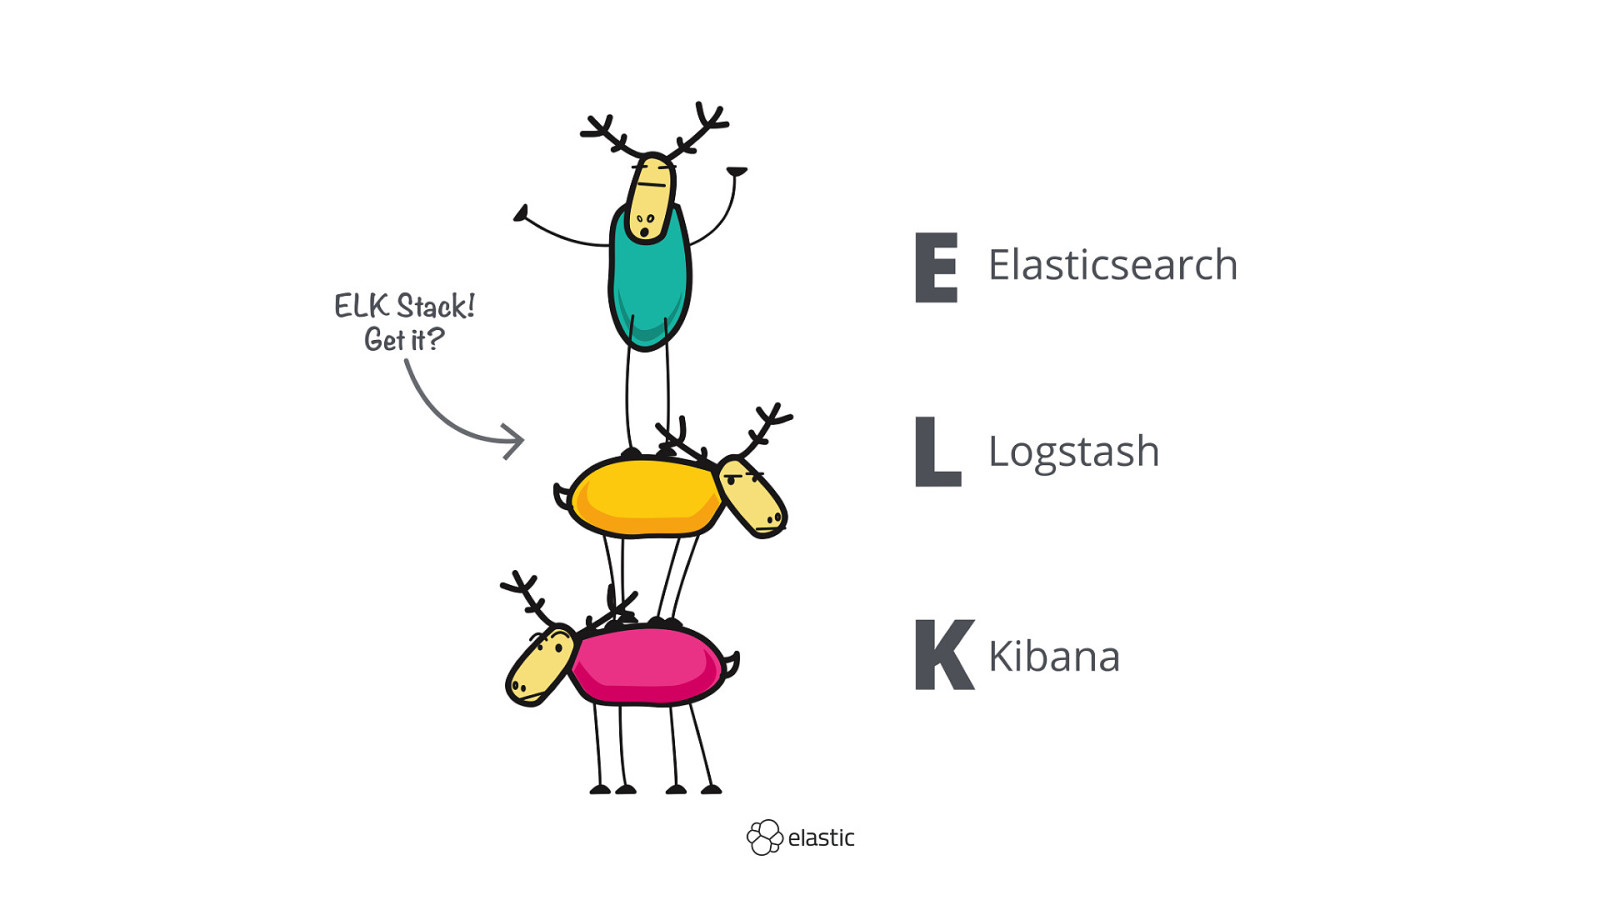
Elasticsearch Search Engine REST Horizontal Scalability
Slide 25
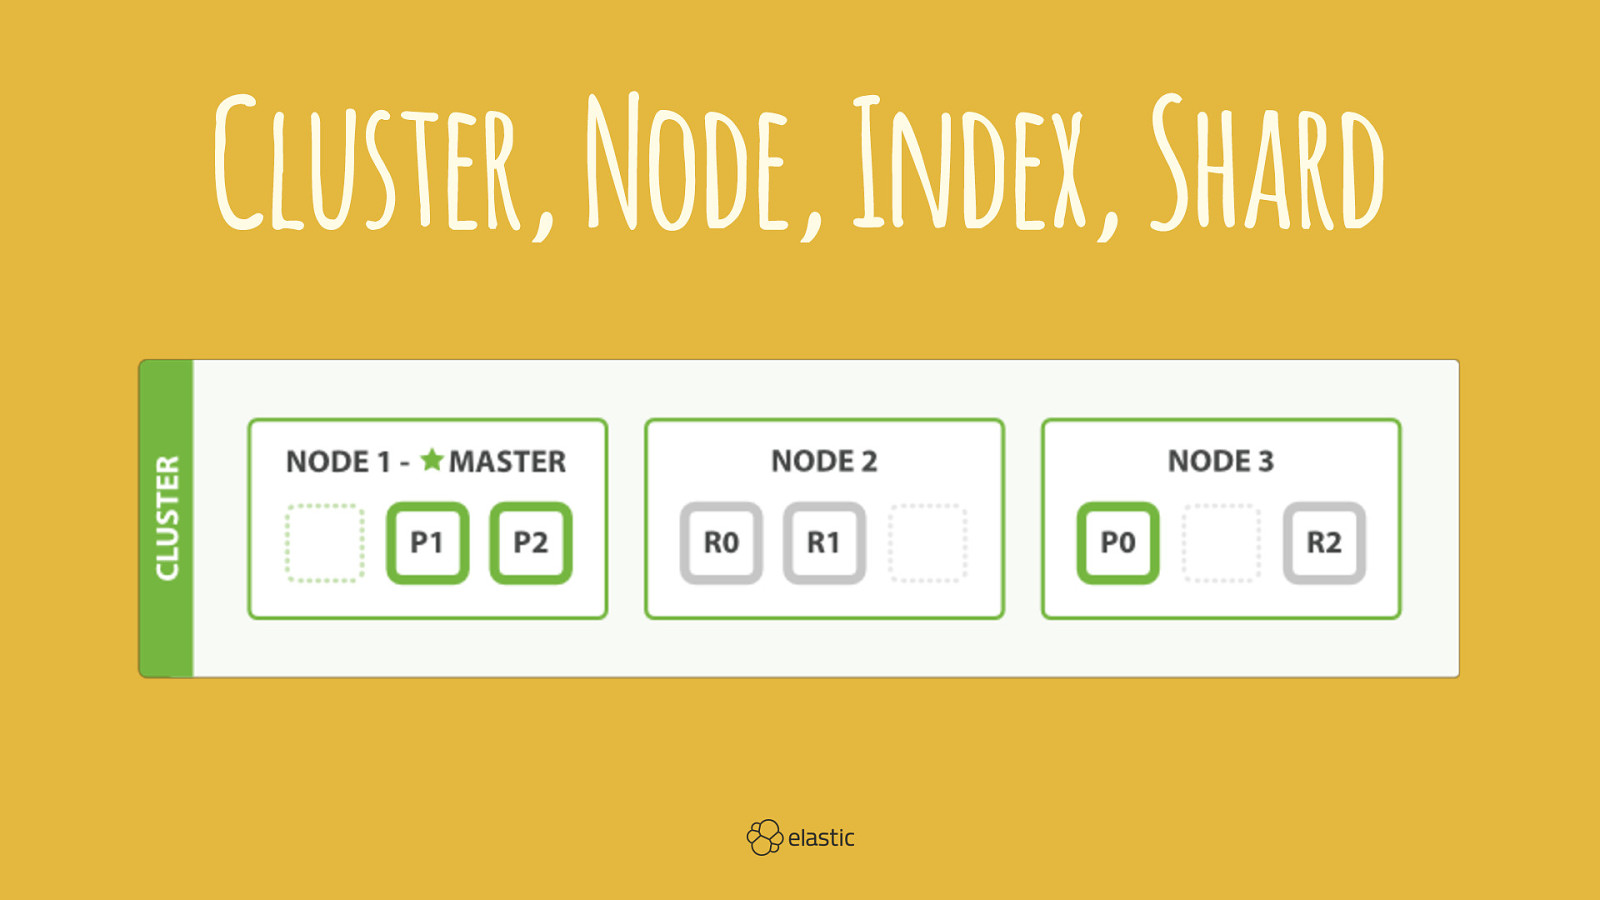
Cluster, Node, Index, Shard
Slide 26
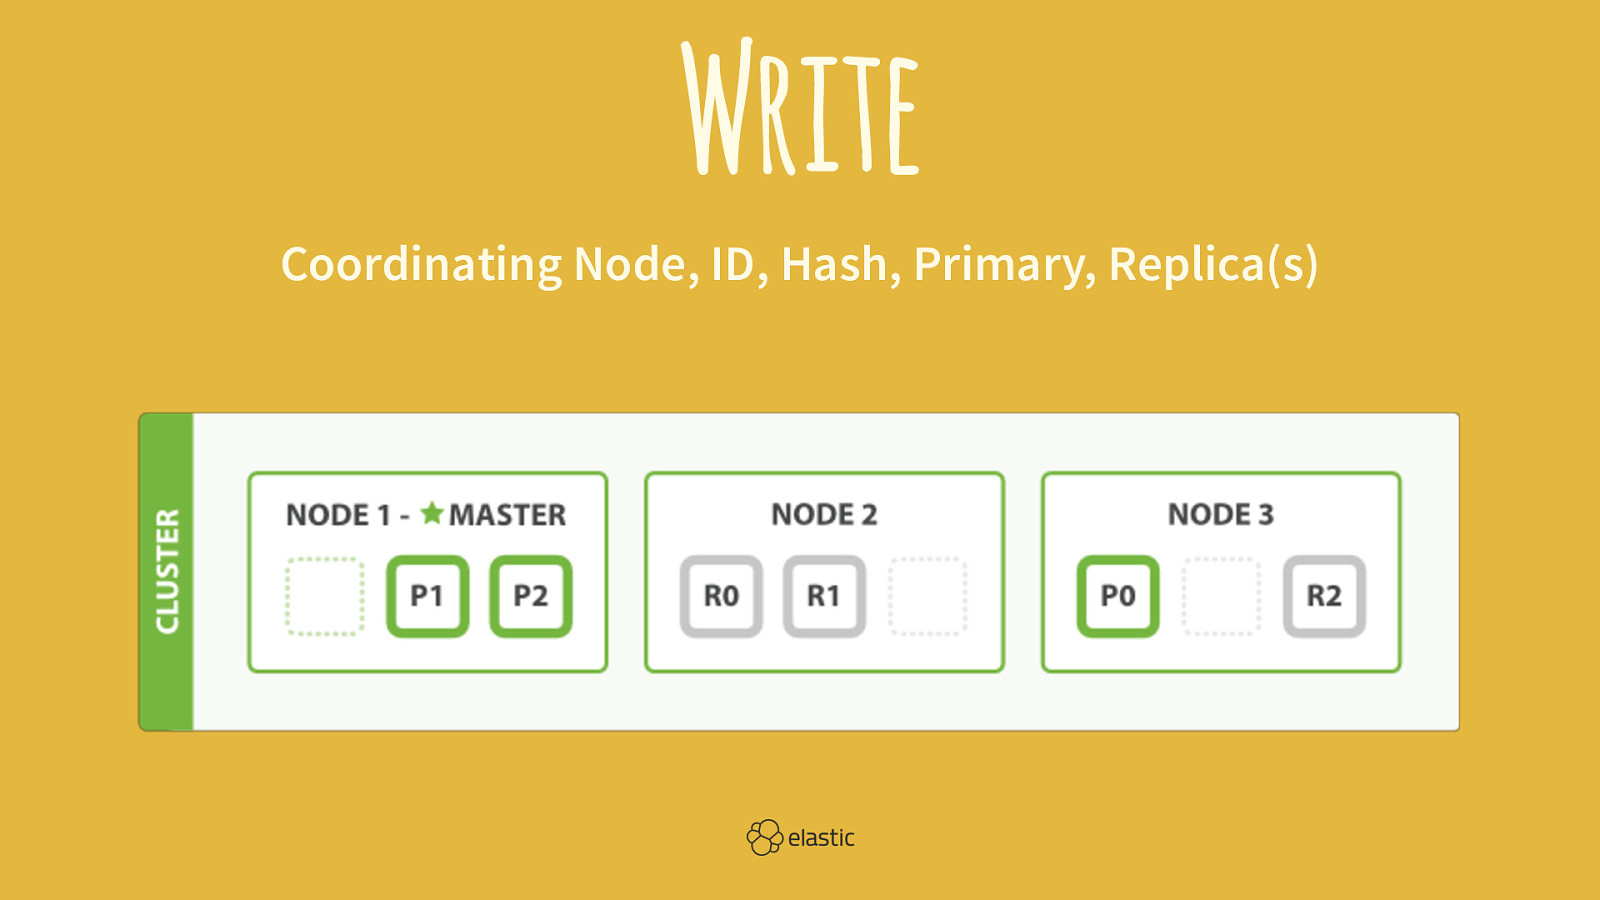
Write Coordinating Node, ID, Hash, Primary, Replica(s)
Slide 27
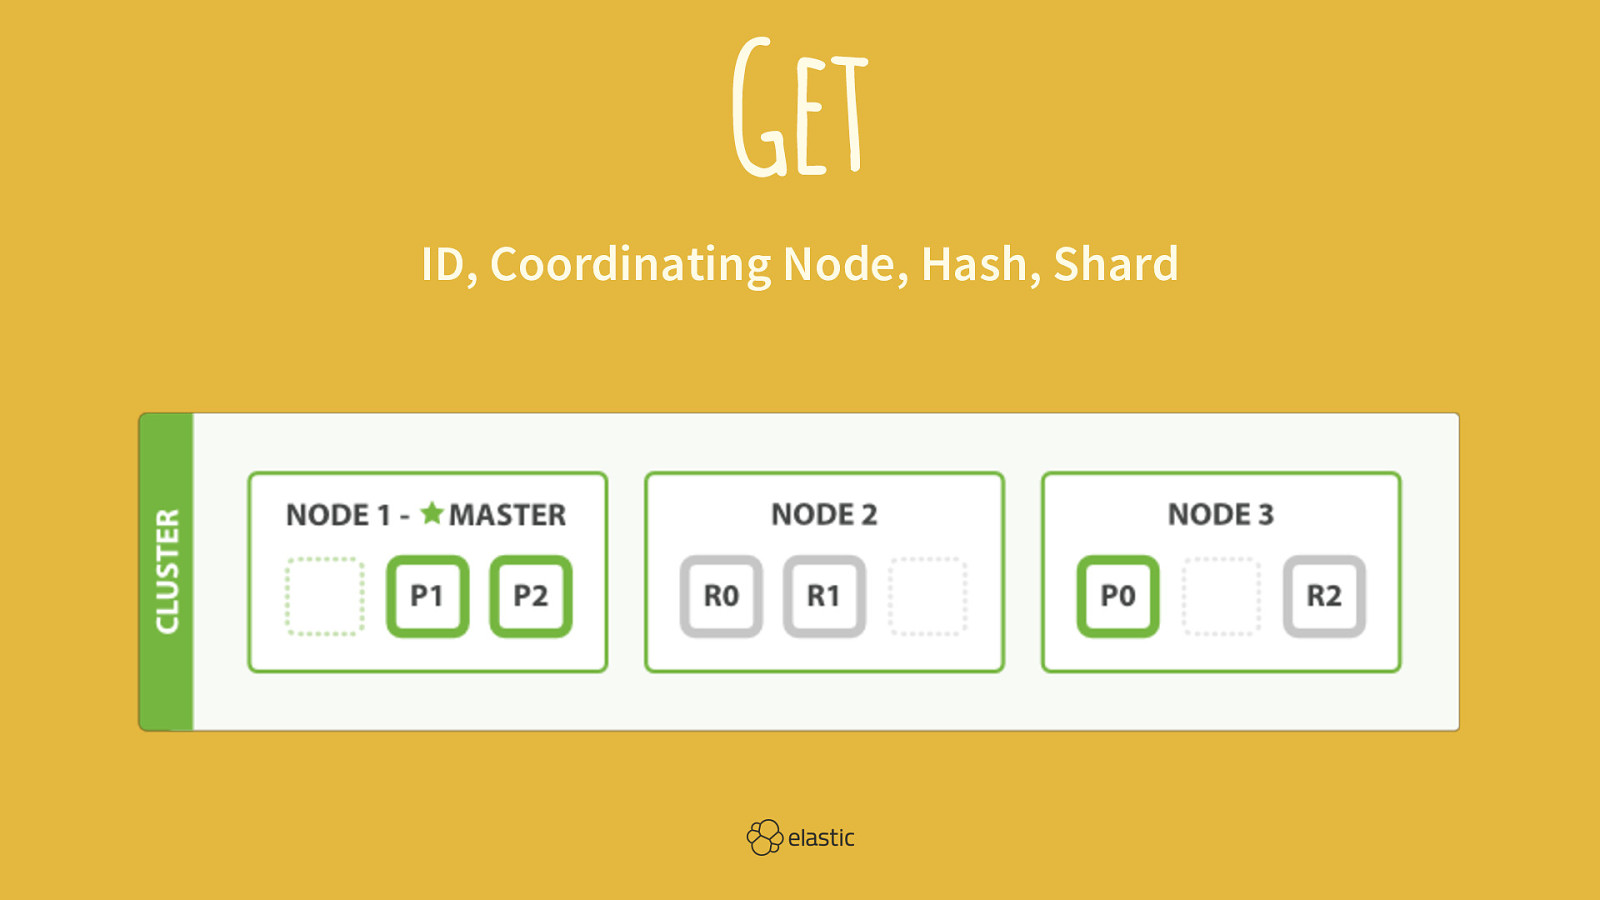
Get ID, Coordinating Node, Hash, Shard
Slide 28
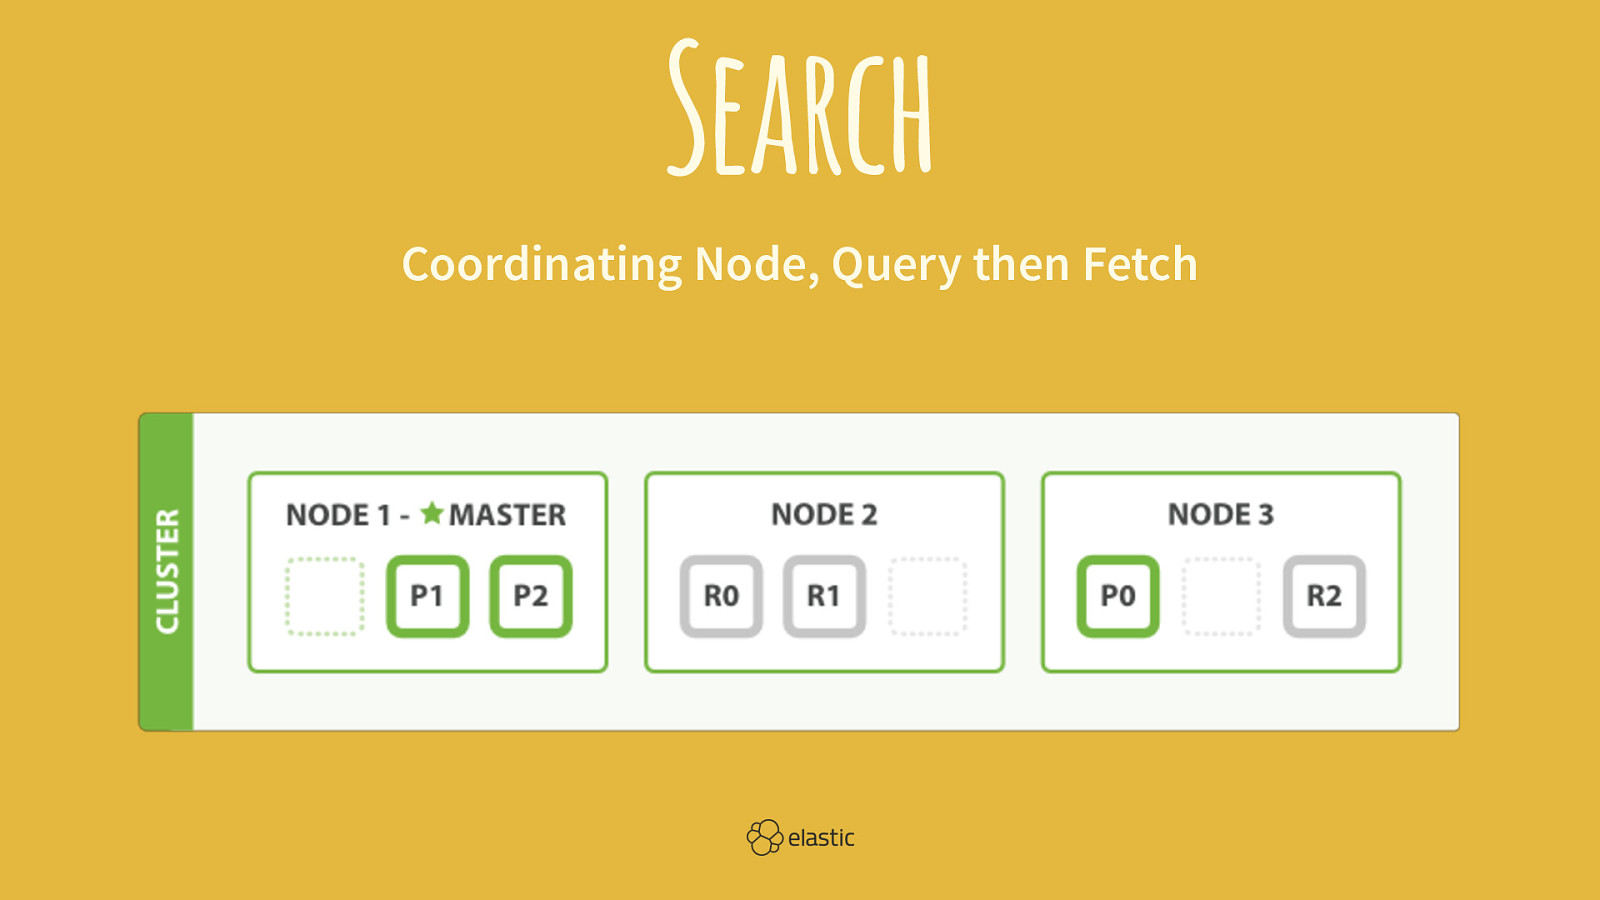
Search Coordinating Node, Query then Fetch
Slide 29
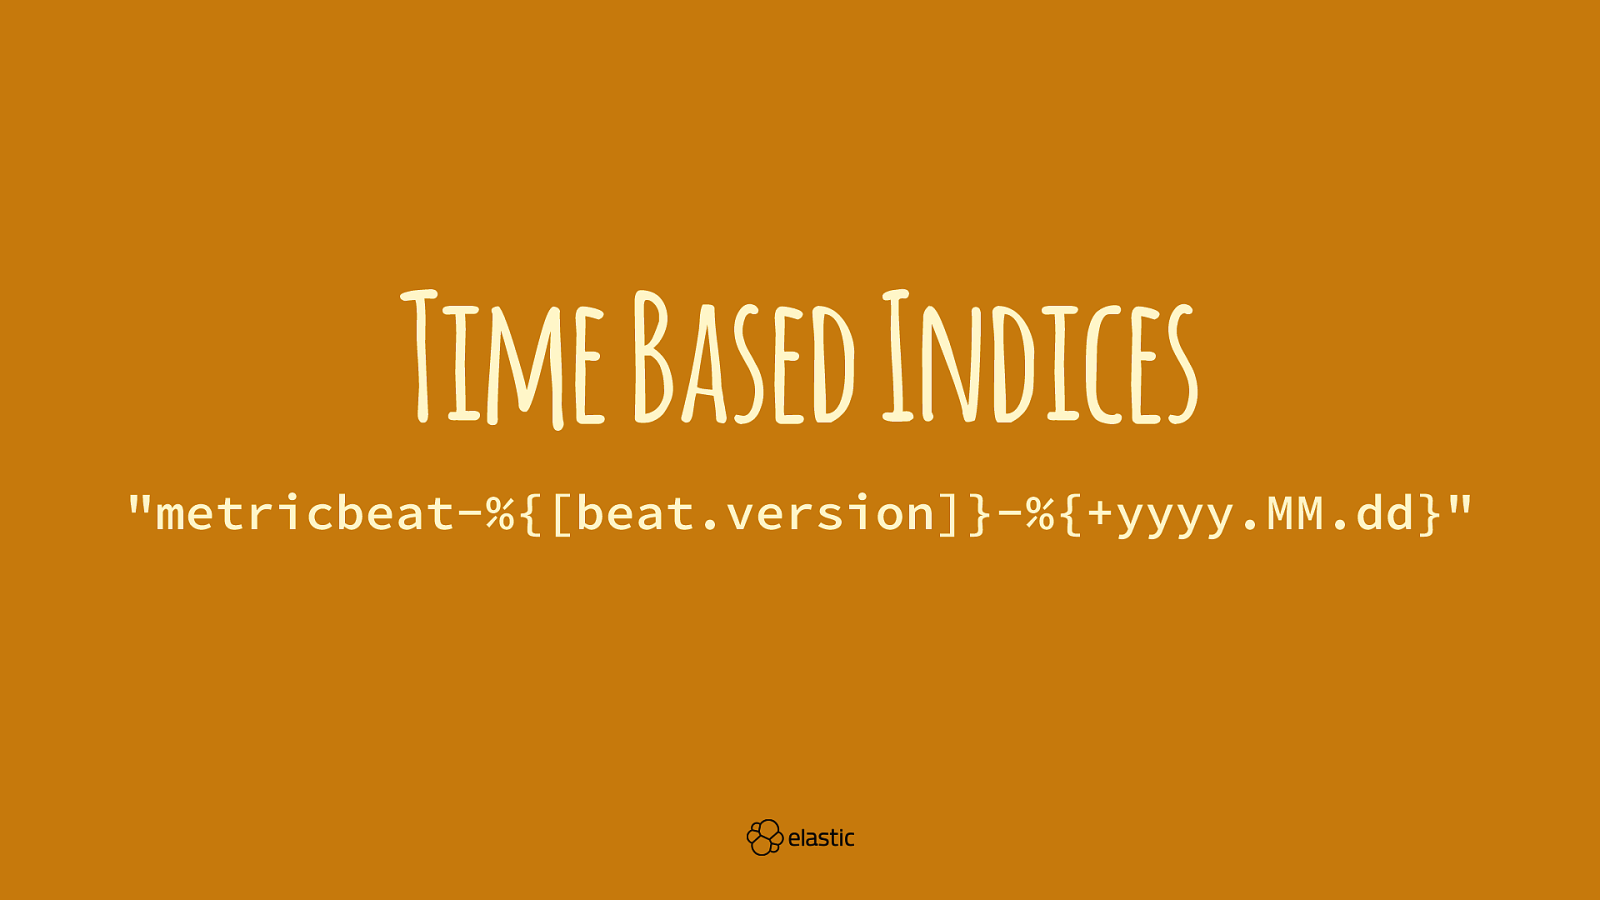
Time Based Indices "metricbeat-%{[beat.version]}-%{+yyyy.MM.dd}"
Slide 30

Nodes ! "
Slide 31
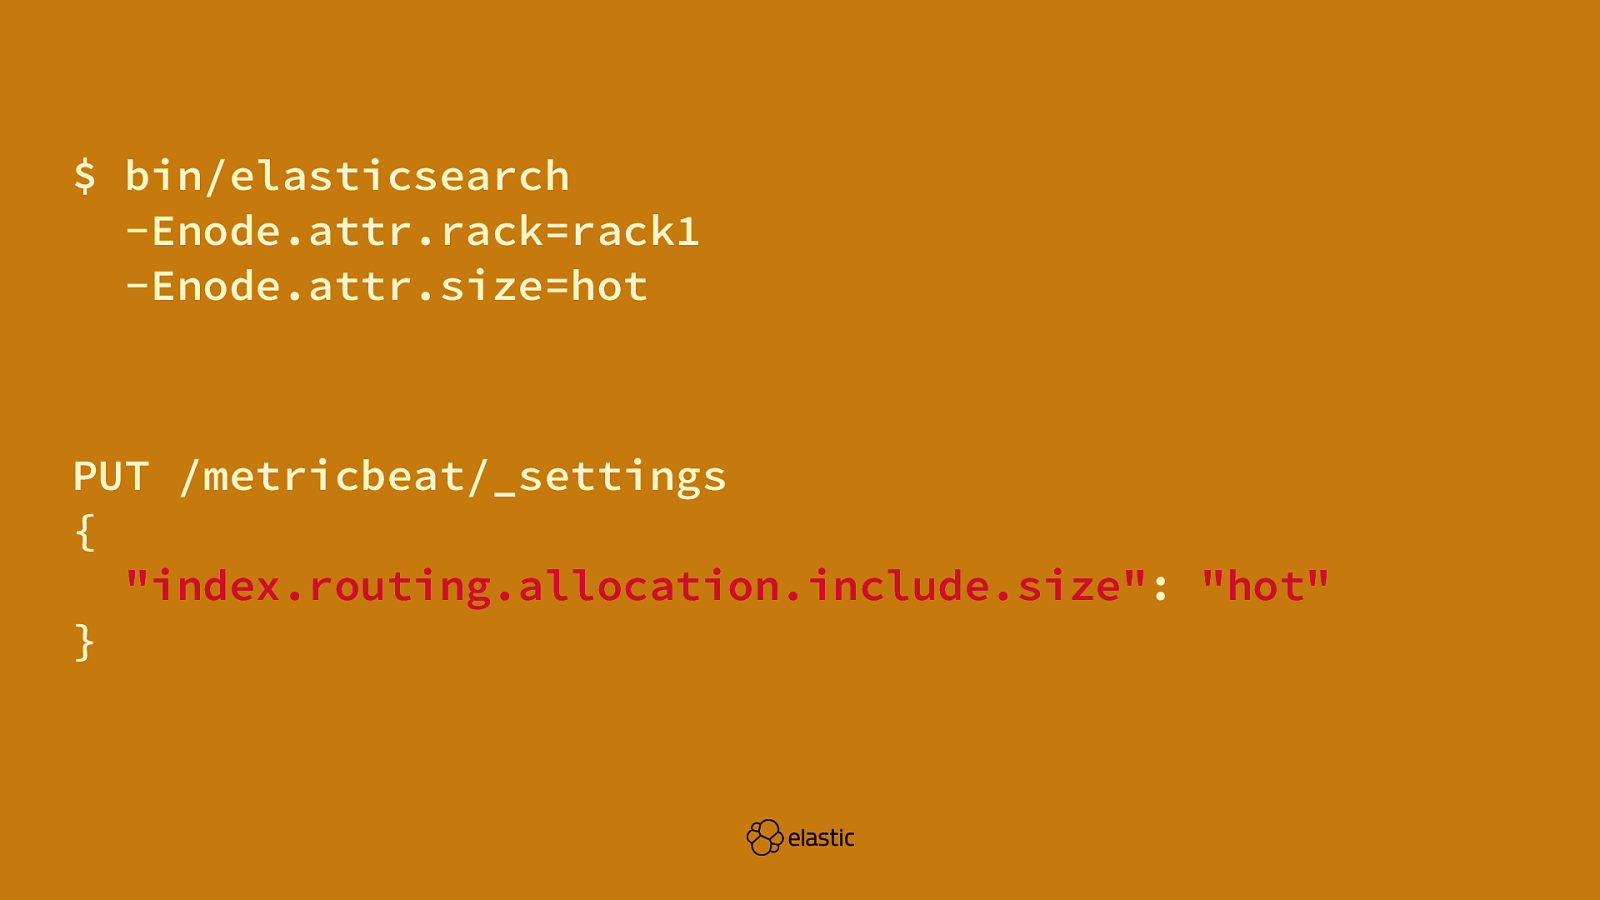
$ bin/elasticsearch -Enode.attr.rack=rack1 -Enode.attr.size=hot PUT /metricbeat/_settings { "index.routing.allocation.include.size": "hot" }
Slide 32

Monitor Java
Slide 33
Code https://github.com/xeraa/ microservice-monitoring
Slide 34

Simple No discovery, load-balancing,...
Slide 35

Slide 36

Slide 37
Slide 38

Slide 39
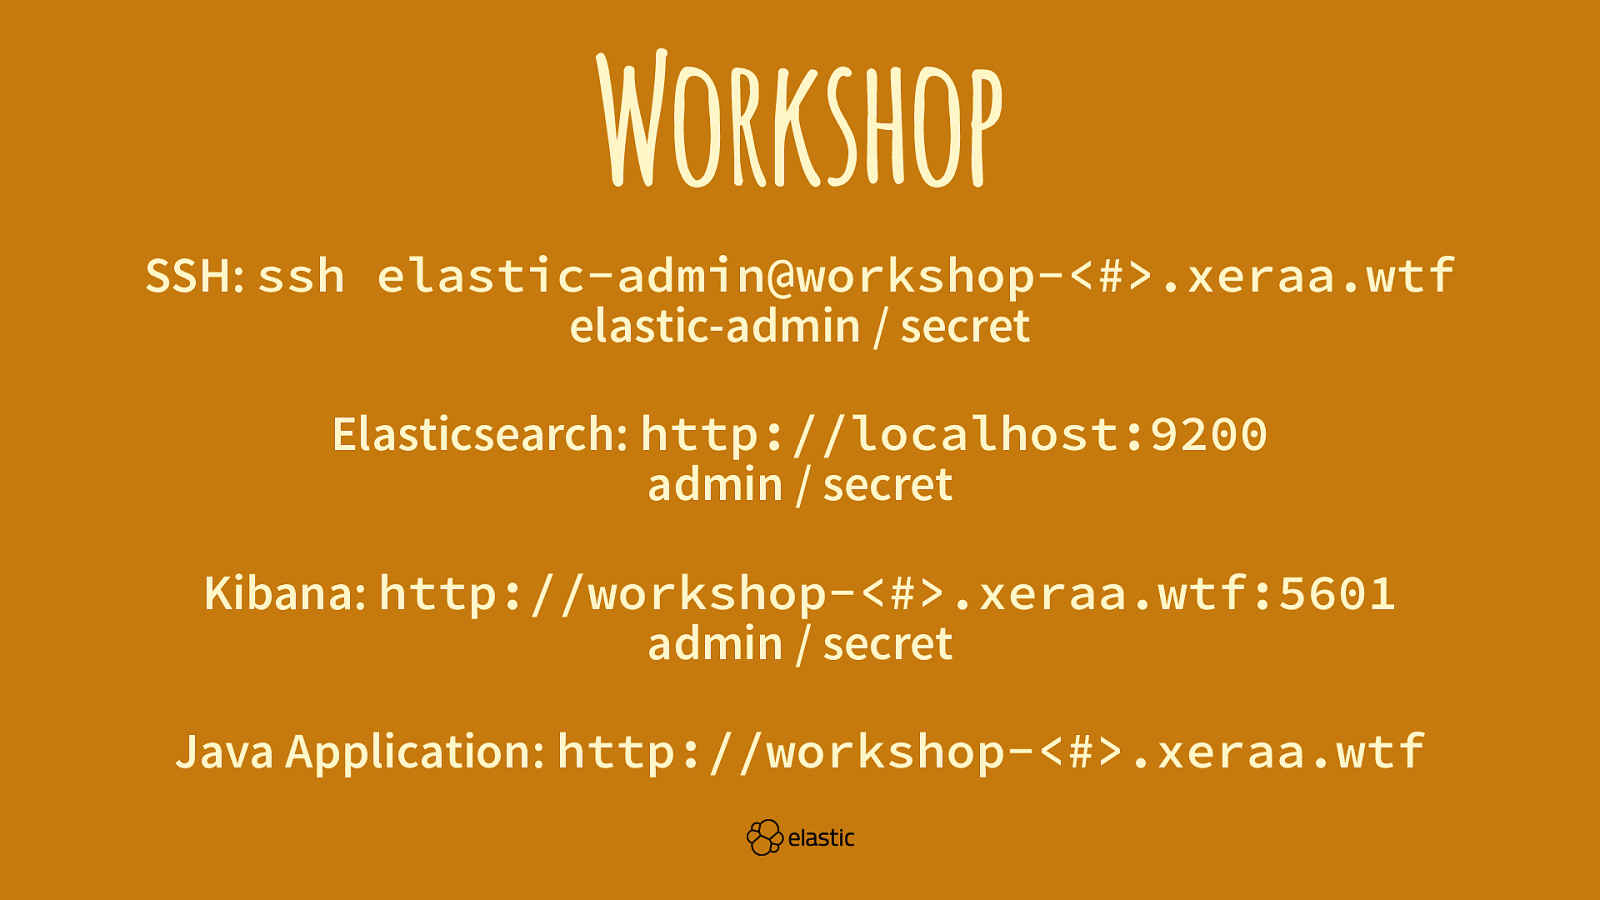
Workshop SSH: ssh elastic-admin@workshop-<#>.xeraa.wtf elastic-admin / secret Elasticsearch: http://localhost:9200 admin / secret Kibana: http://workshop-<#>.xeraa.wtf:5601 admin / secret Java Application: http://workshop-<#>.xeraa.wtf
Slide 40

Kibana Monitoring Overview of the Elastic Stack components
Slide 41
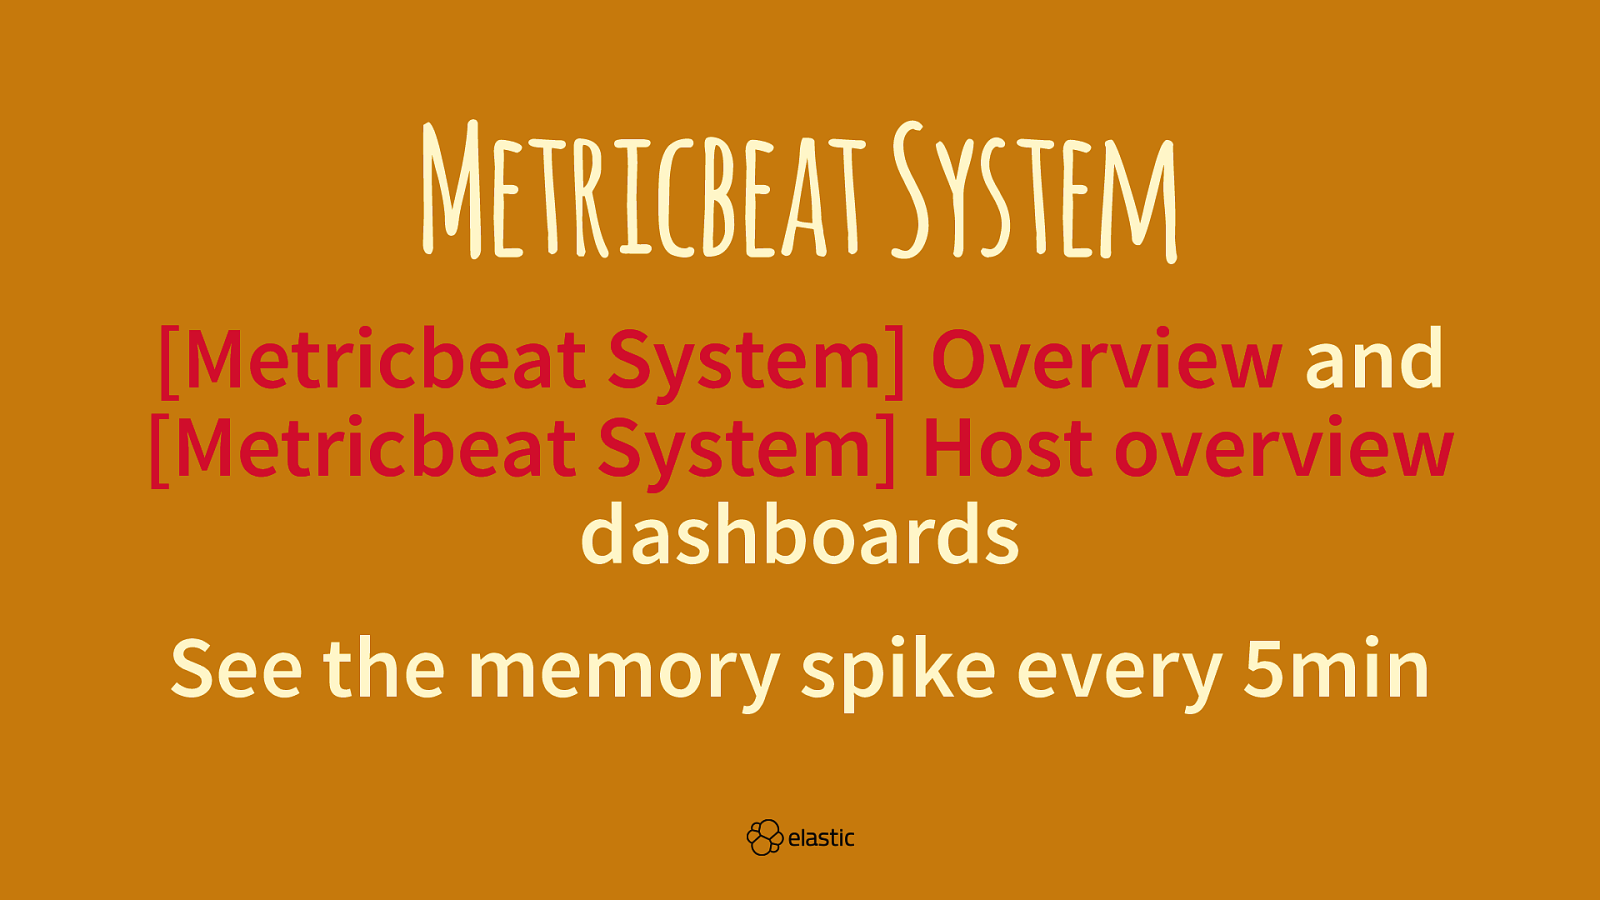
Metricbeat System [Metricbeat System] Overview and [Metricbeat System] Host overview dashboards See the memory spike every 5min
Slide 42
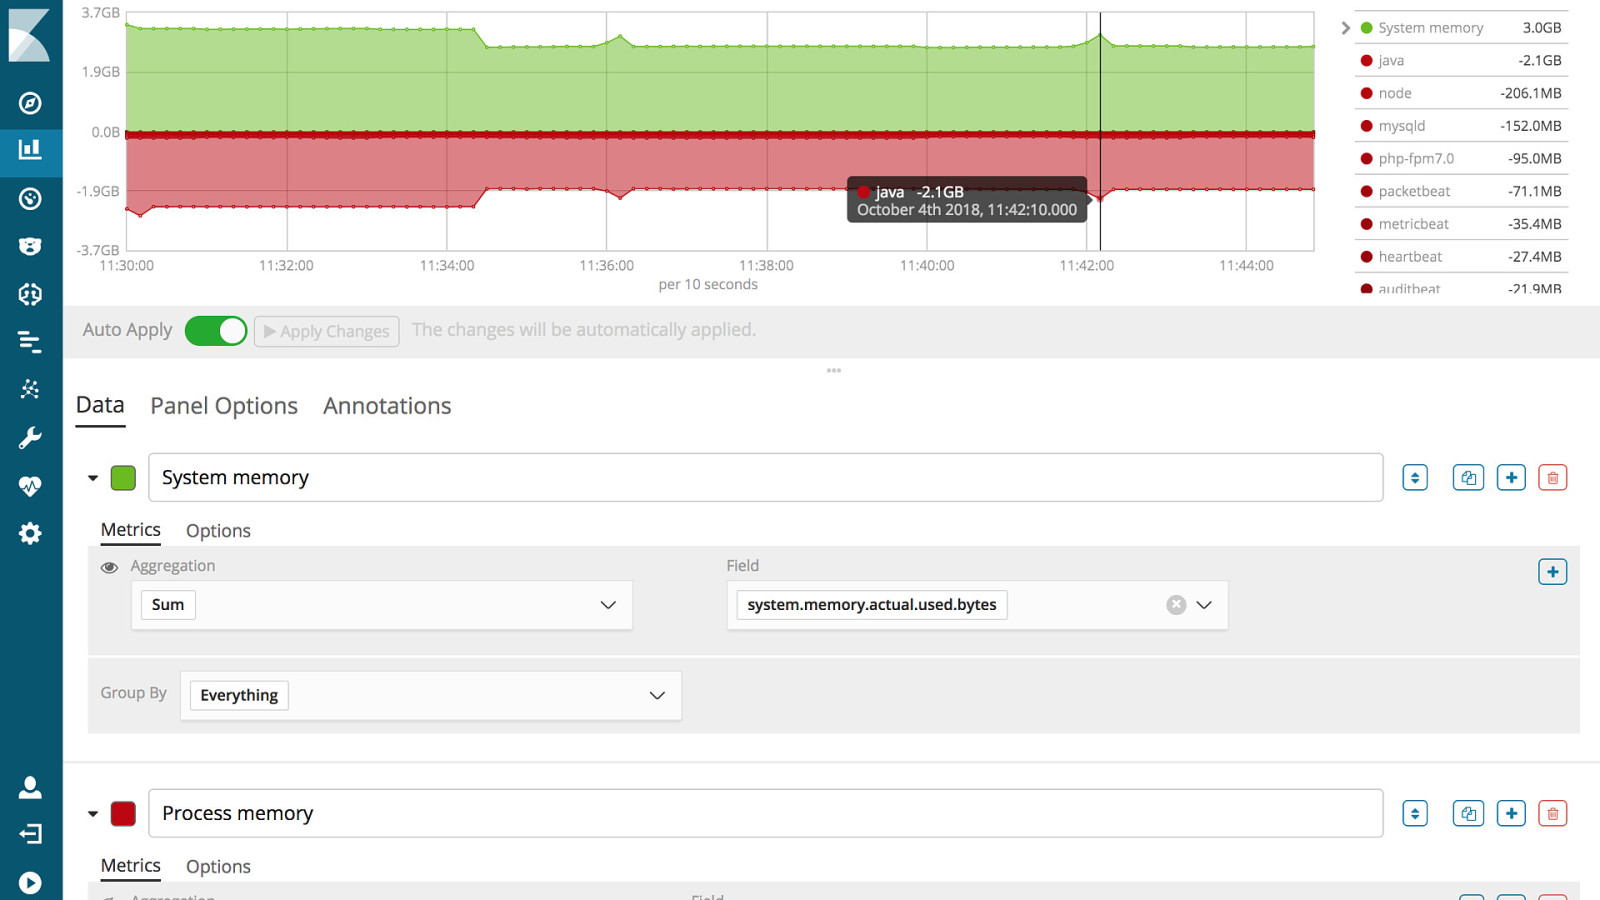
Time Series Visual Builder Sum of system.memory.actual.used.bytes Sum of system.process.memory. rss.bytes grouped by the term system.process.name and moved to the negative y-axis with a Math step
Slide 43
Slide 44
Packetbeat Call /, /good, /bad, and /foobar [Packetbeat] Overview, [Packetbeat] Flows, [Packetbeat] HTTP, and [Packetbeat] DNS Tunneling dashboards
Slide 45
Packetbeat Raw events in Discover Process enrichment for nginx, Java, and the APM server
Slide 46
Filebeat Modules [Filebeat Nginx] Access and error logs, [Filebeat System] Syslog dashboard, and [Osquery Result] Compliance pack dashboards
Slide 47

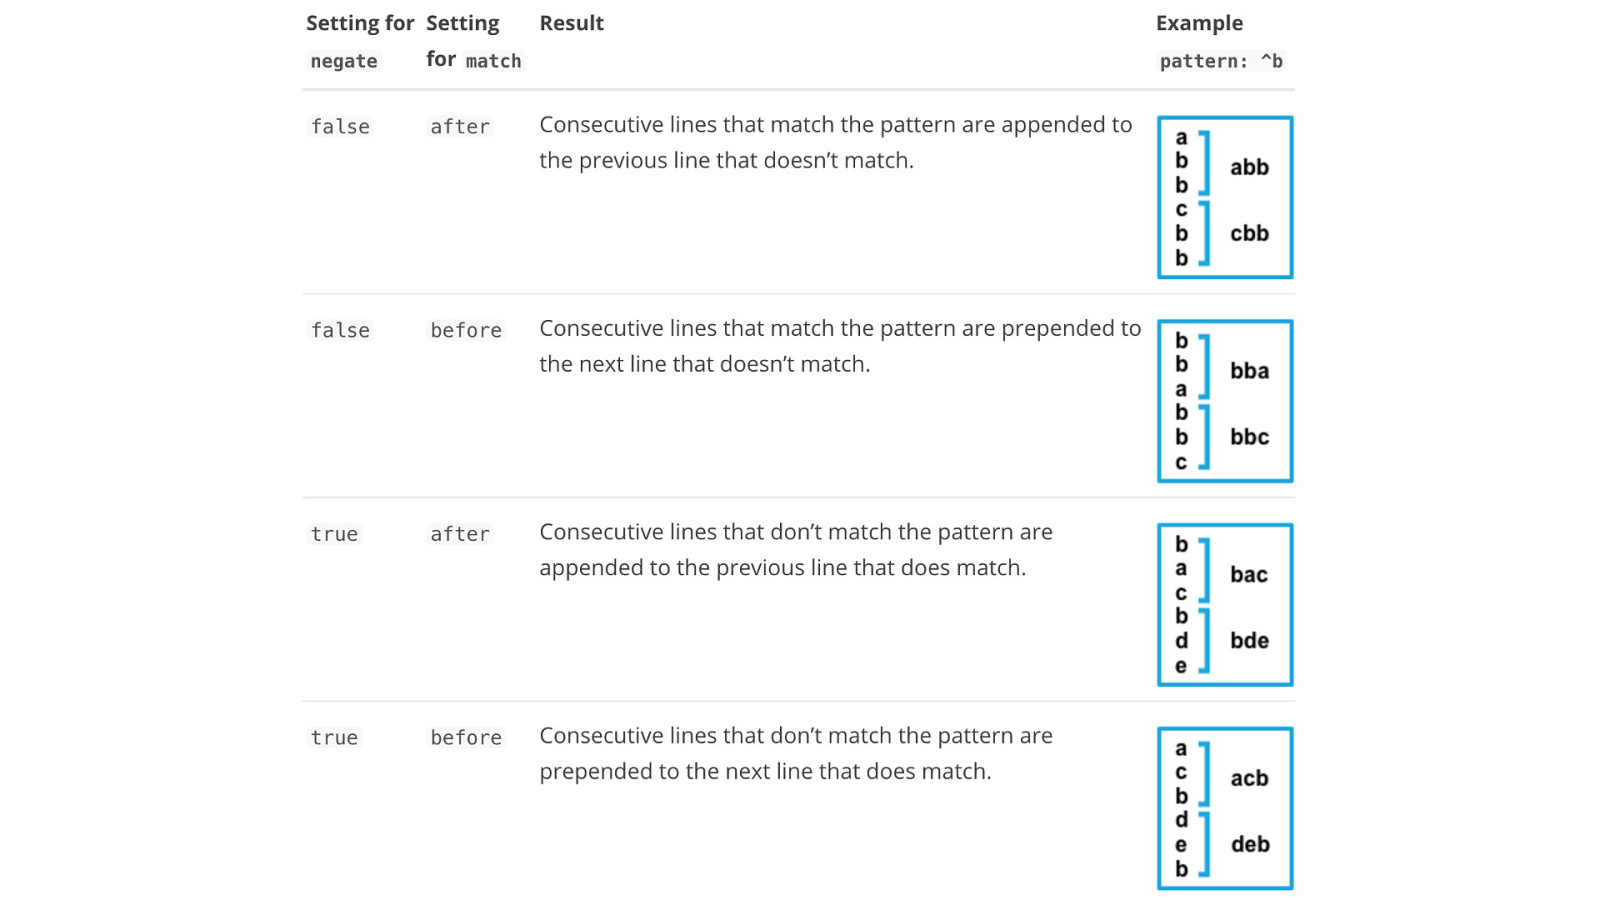
Custom Log Files
Slide 48
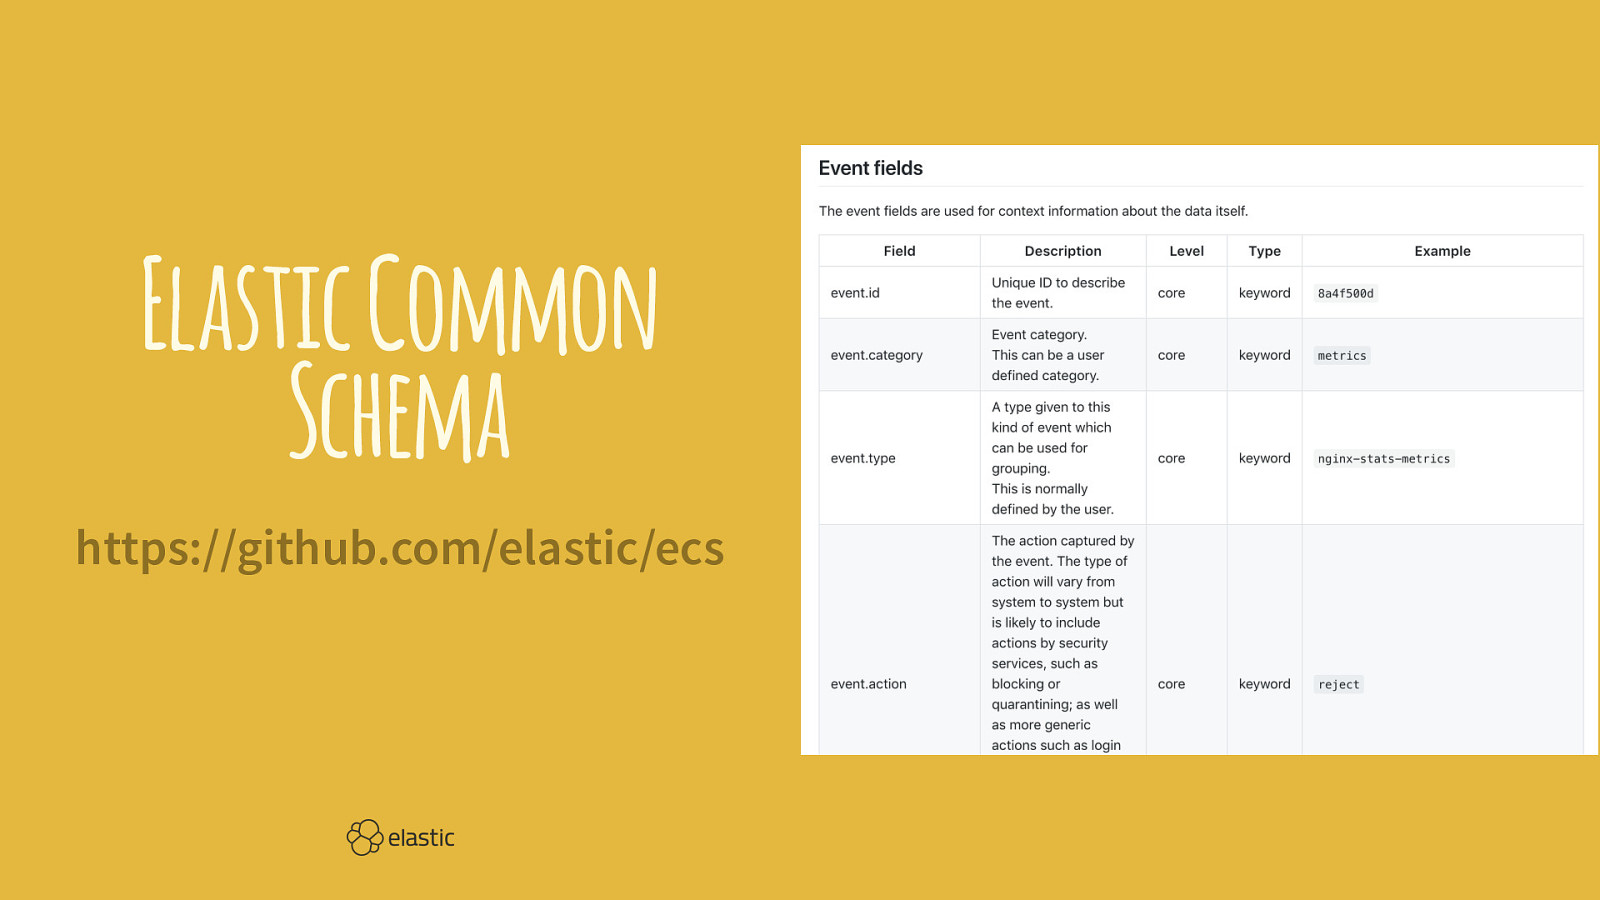
Elastic Common Schema https://github.com/elastic/ecs
Slide 49
Slide 50
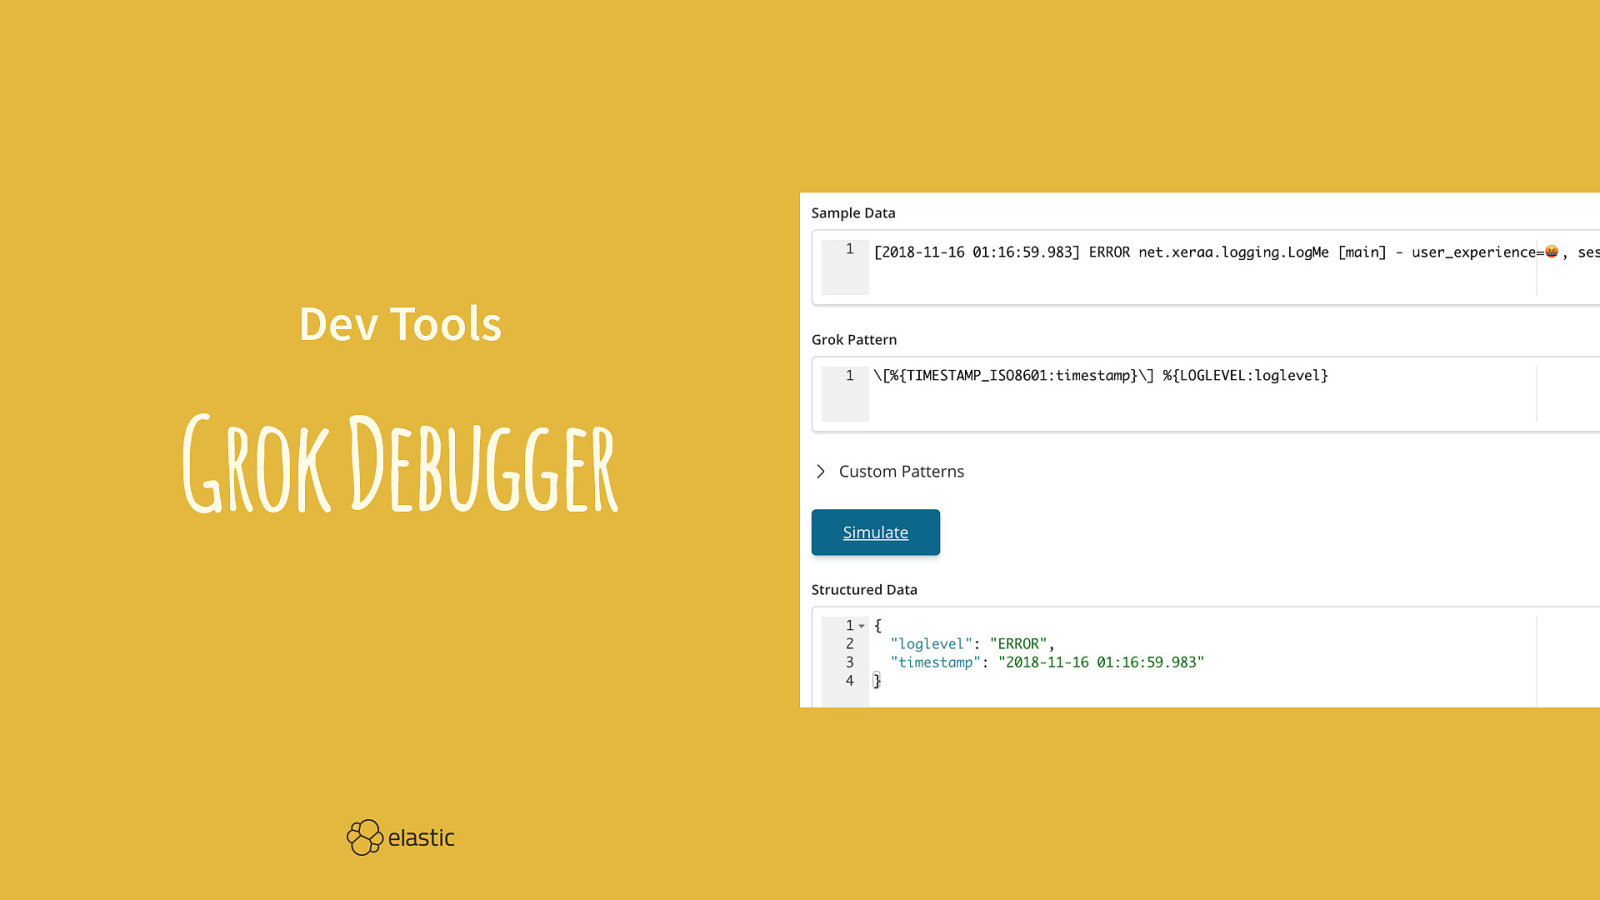
Dev Tools Grok Debugger
Slide 51
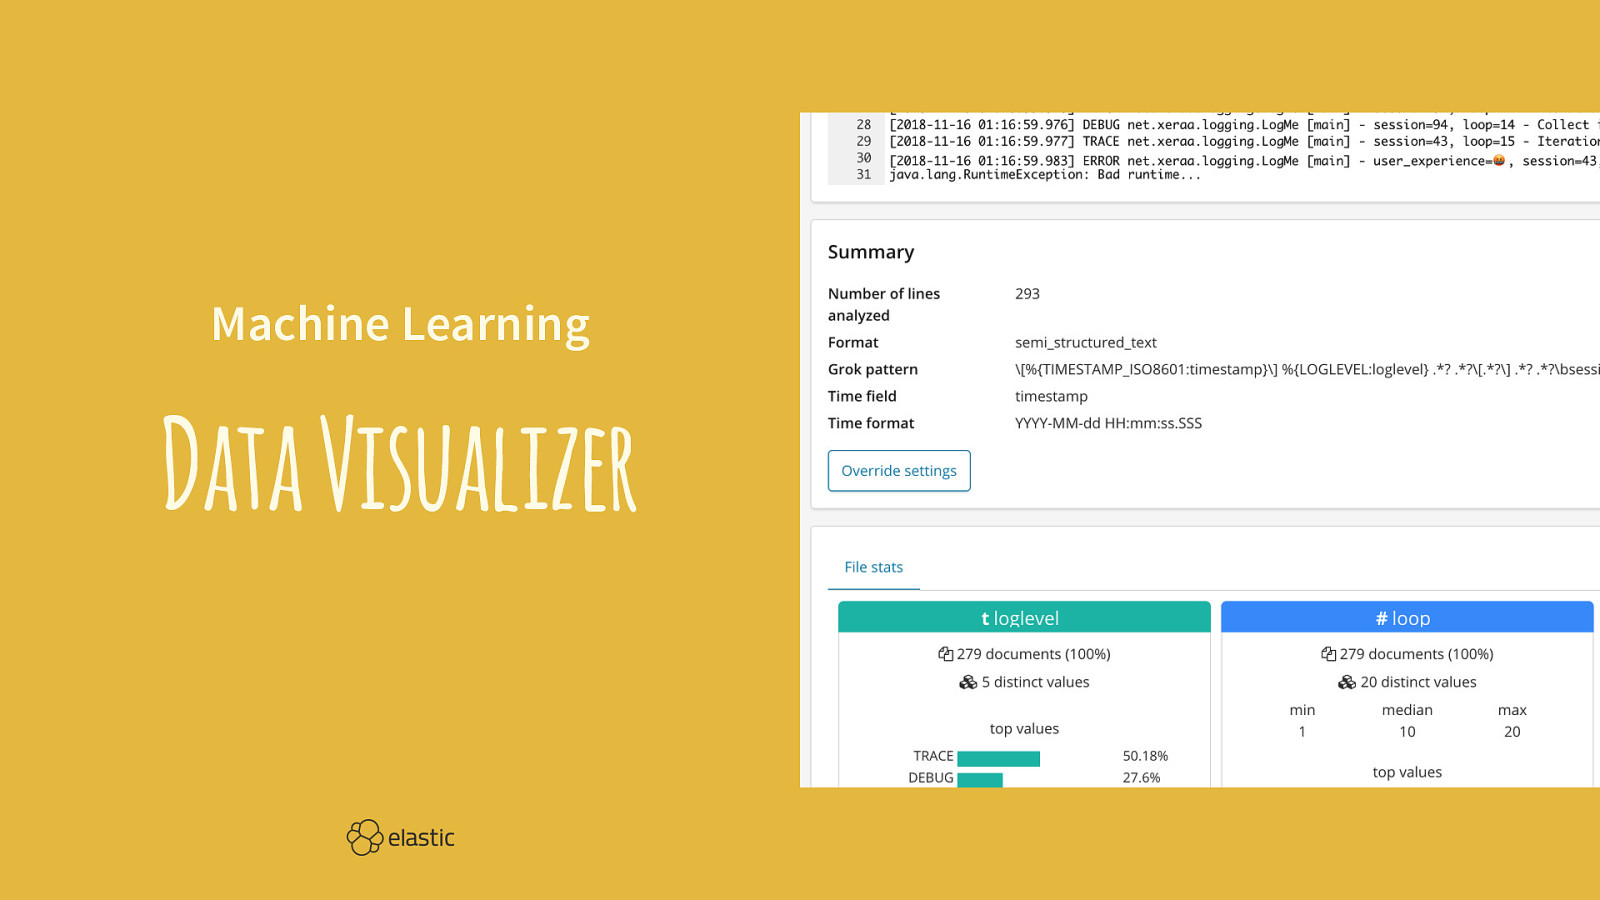
Machine Learning Data Visualizer
Slide 52

Log UI
Slide 53

Infra UI
Slide 54
Filebeat Raw events in Discover /good: MDC logging under json.name and the context view for one log message meta.* and host.* information
Slide 55
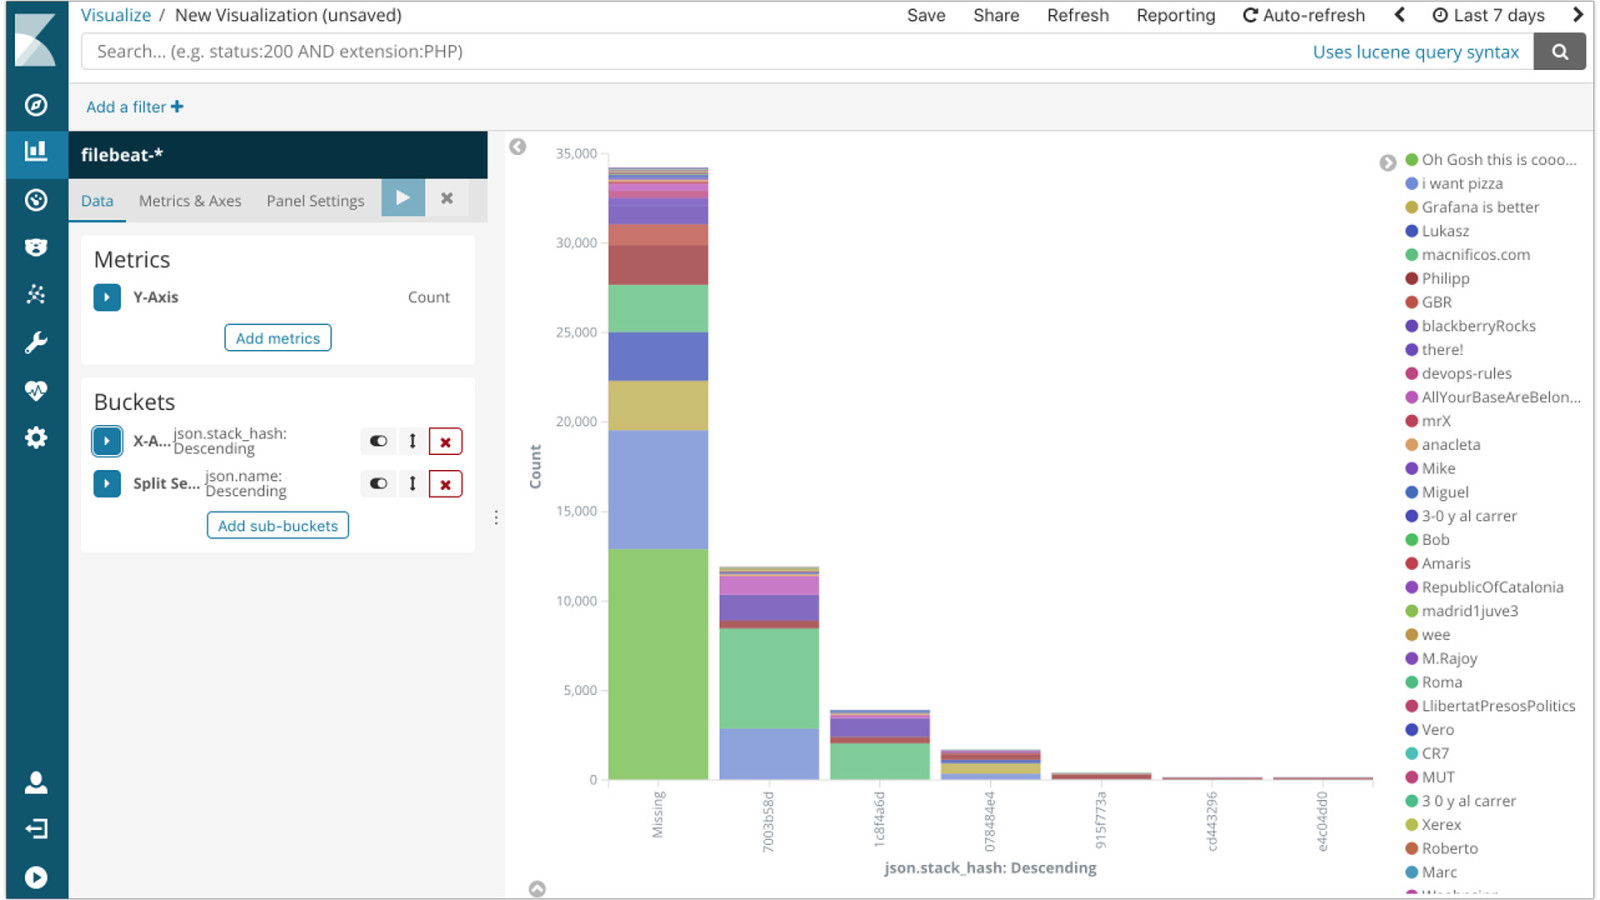
Filebeat /bad and /null: Stacktraces by filtering down on application:java and json.severity:ERROR Visualize json.stack_hash
Slide 56
Slide 57
Heartbeat Heartbeat HTTP monitoring dashboard Stop and start the frontend application while auto refreshing
Slide 58

Metricbeat nginx [Metricbeat Nginx] Overview dashboard
Slide 59
Metricbeat HTTP /health and /metrics endpoints Collected information in Discover
Slide 60
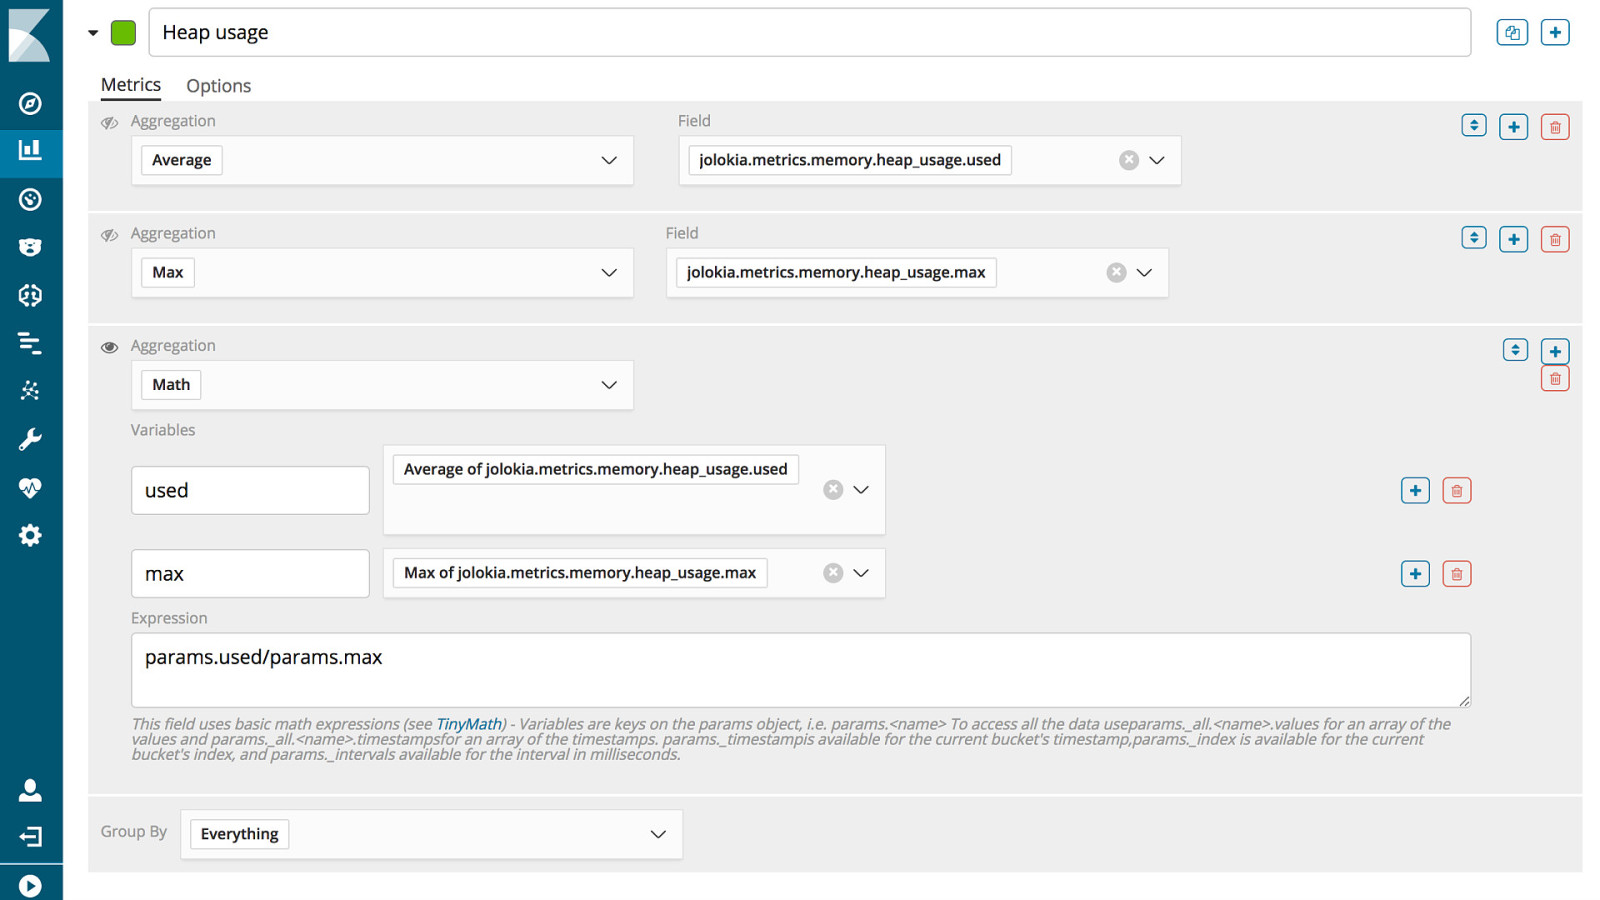
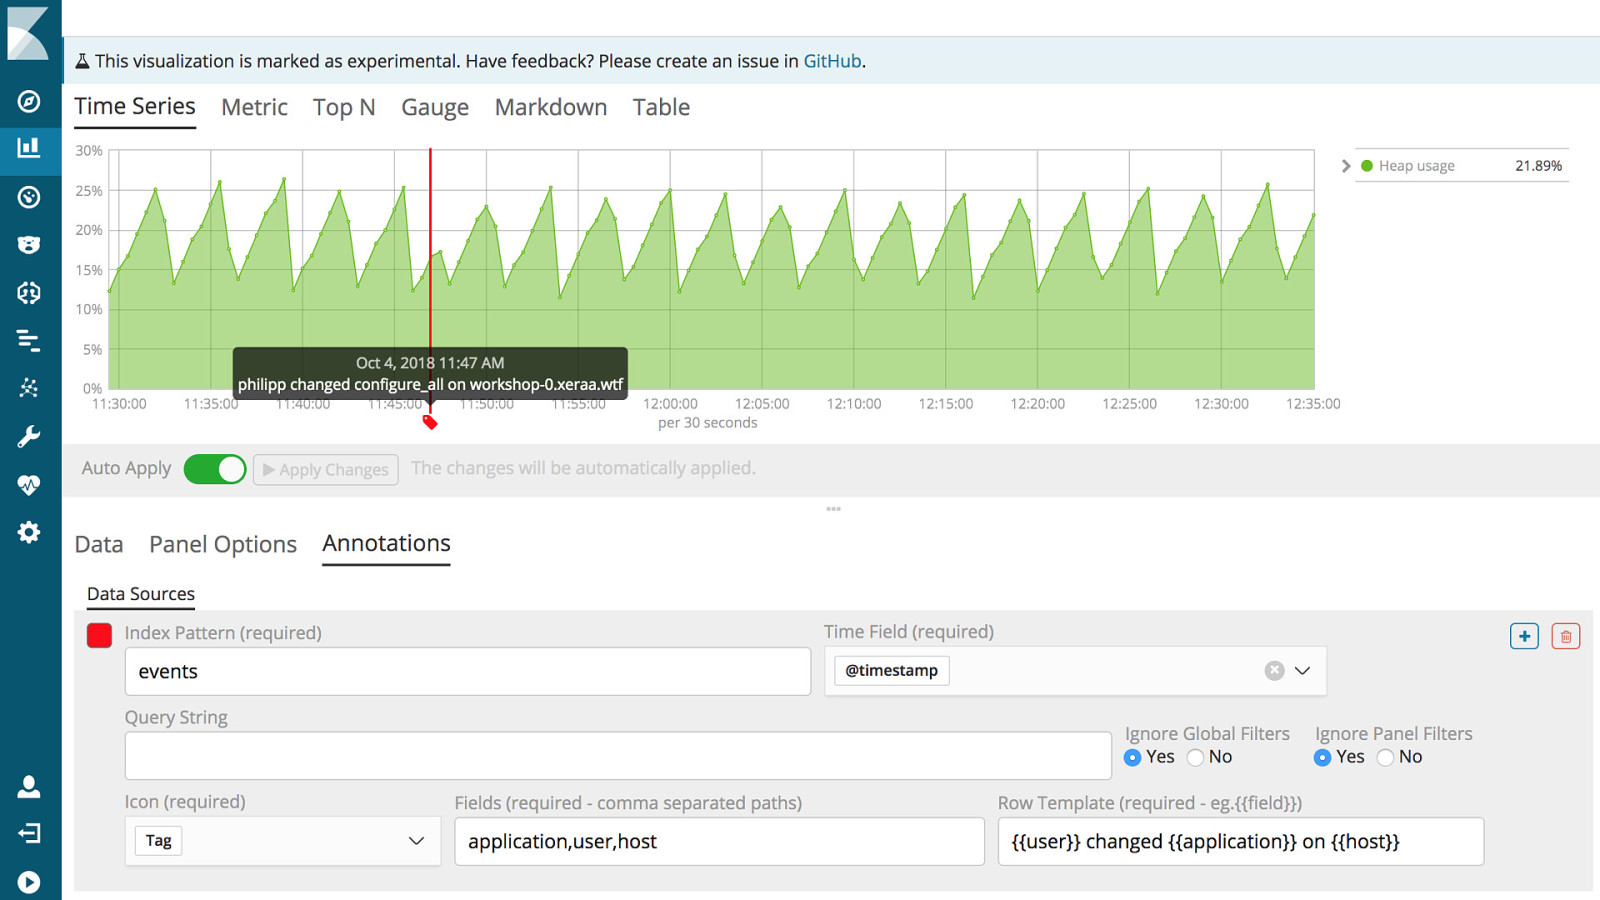
Metricbeat JMX Same data Visualize the heap usage: jolokia. metrics.memory.heap_usage.used divided by the max of jolokia. metrics.memory.heap_usage.max
Slide 61

Annotations Add changes from the events index
Slide 62
Slide 63
Slide 64
APM Distributed Tracing
Slide 65

Some Security
Slide 66

Filebeat Modules [Filebeat Auditd] Audit Events, [Filebeat System] New users and groups, and [Filebeat System] Sudo commands dashboards
Slide 67
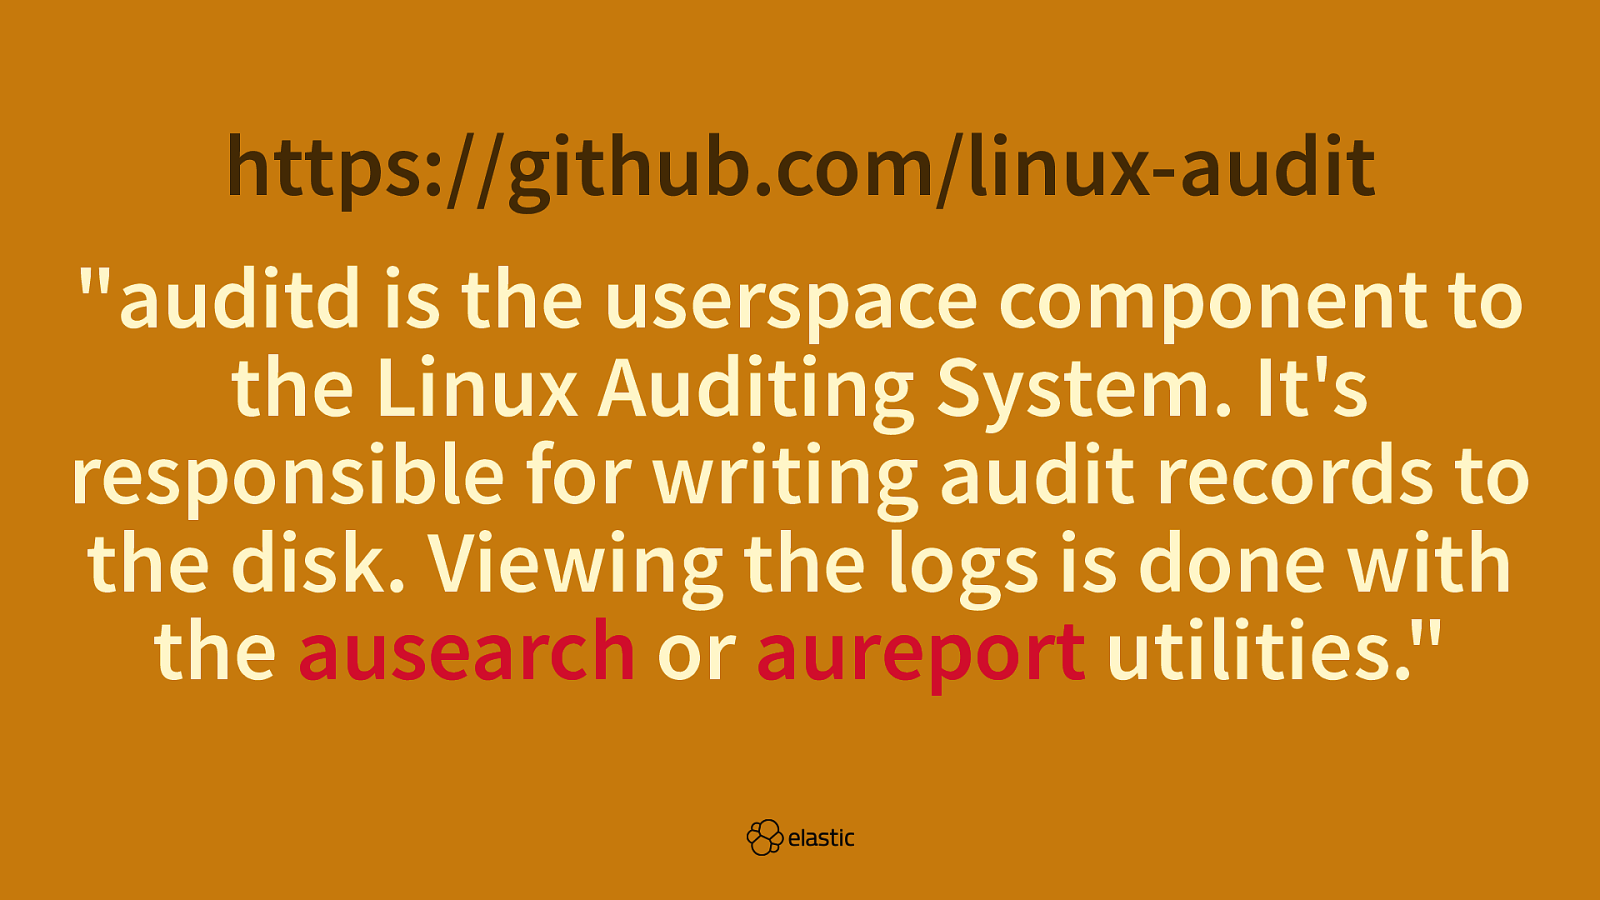
https://github.com/linux-audit "auditd is the userspace component to the Linux Auditing System. It's responsible for writing audit records to the disk. Viewing the logs is done with the ausearch or aureport utilities."
Slide 68
Auditd Monitors File and network access System calls Commands run by a user Security events
Slide 69
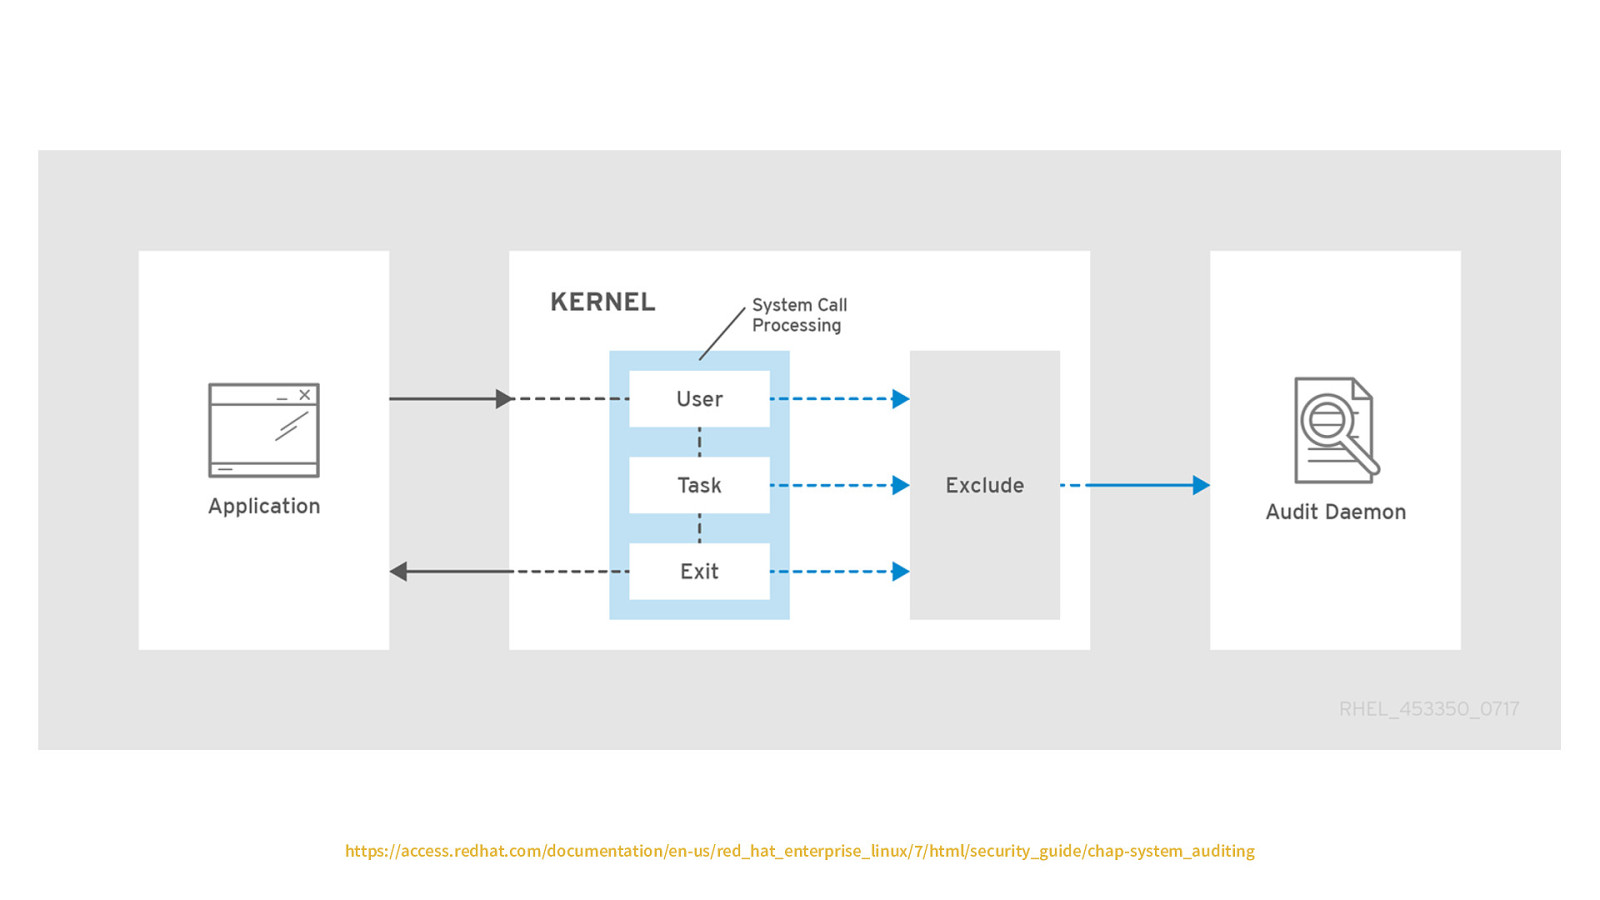
https://access.redhat.com/documentation/en-us/red_hat_enterprise_linux/7/html/security_guide/chap-system_auditing
Slide 70
Understanding Logs https://access.redhat.com/ documentation/en-us/ red_hat_enterprise_linux/7/html/ security_guide/secunderstanding_audit_log_files
Slide 71
Auditbeat [Auditbeat Auditd] Overview dashboard
Slide 72
Fail SSH ssh elastic-user@xeraa.wtf with a bad password [Filebeat System] SSH login attempts dashboard
Slide 73
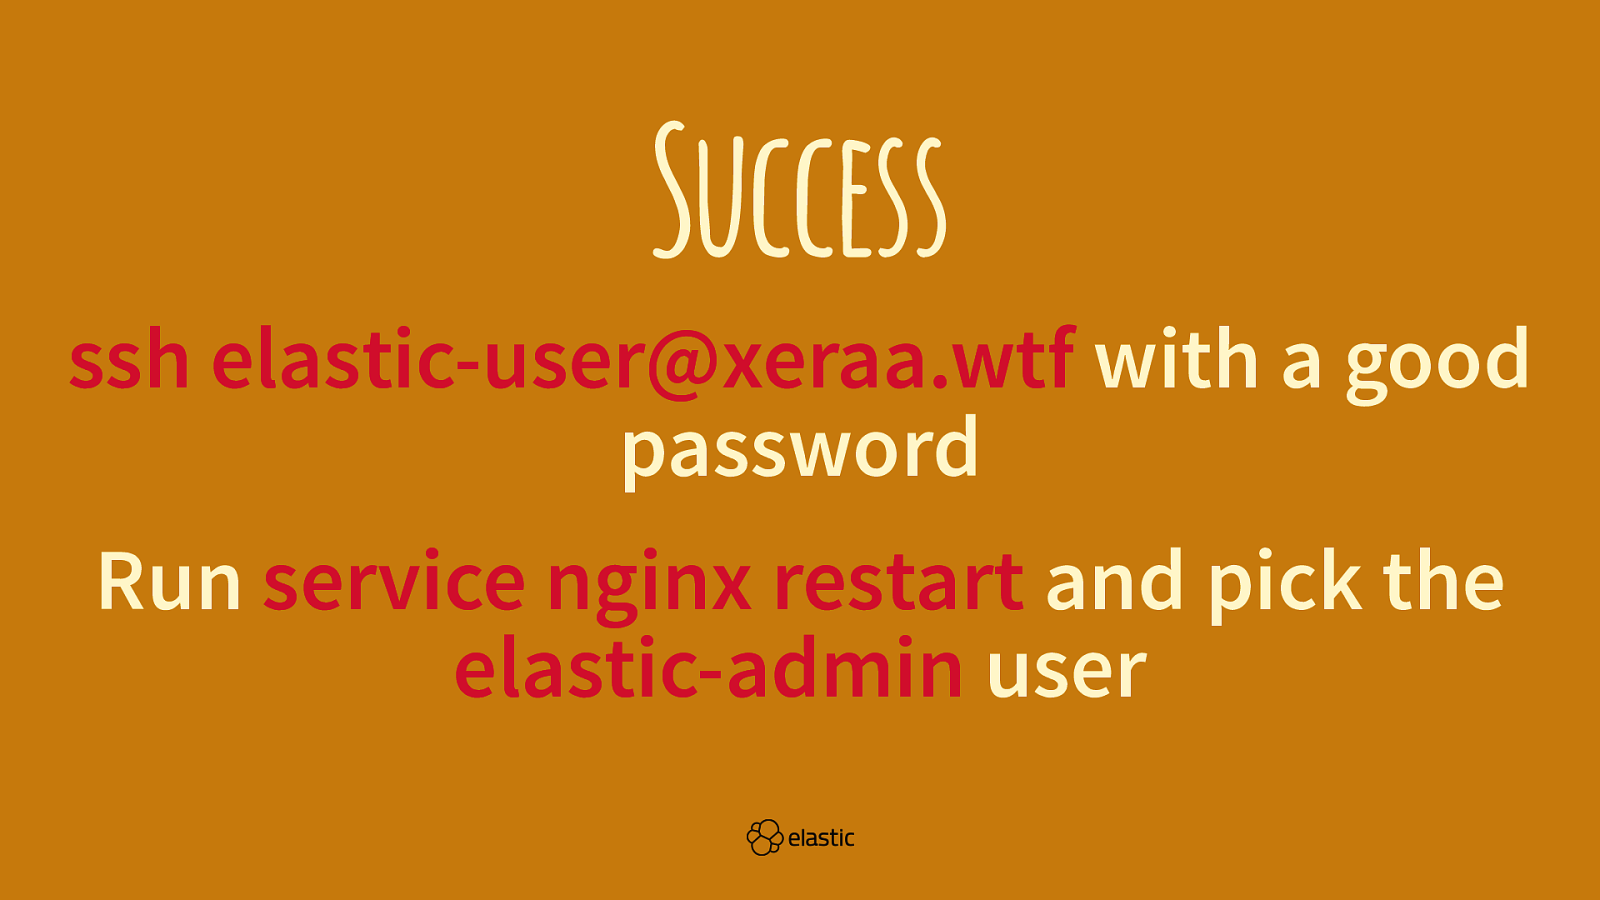
Success ssh elastic-user@xeraa.wtf with a good password Run service nginx restart and pick the elastic-admin user
Slide 74
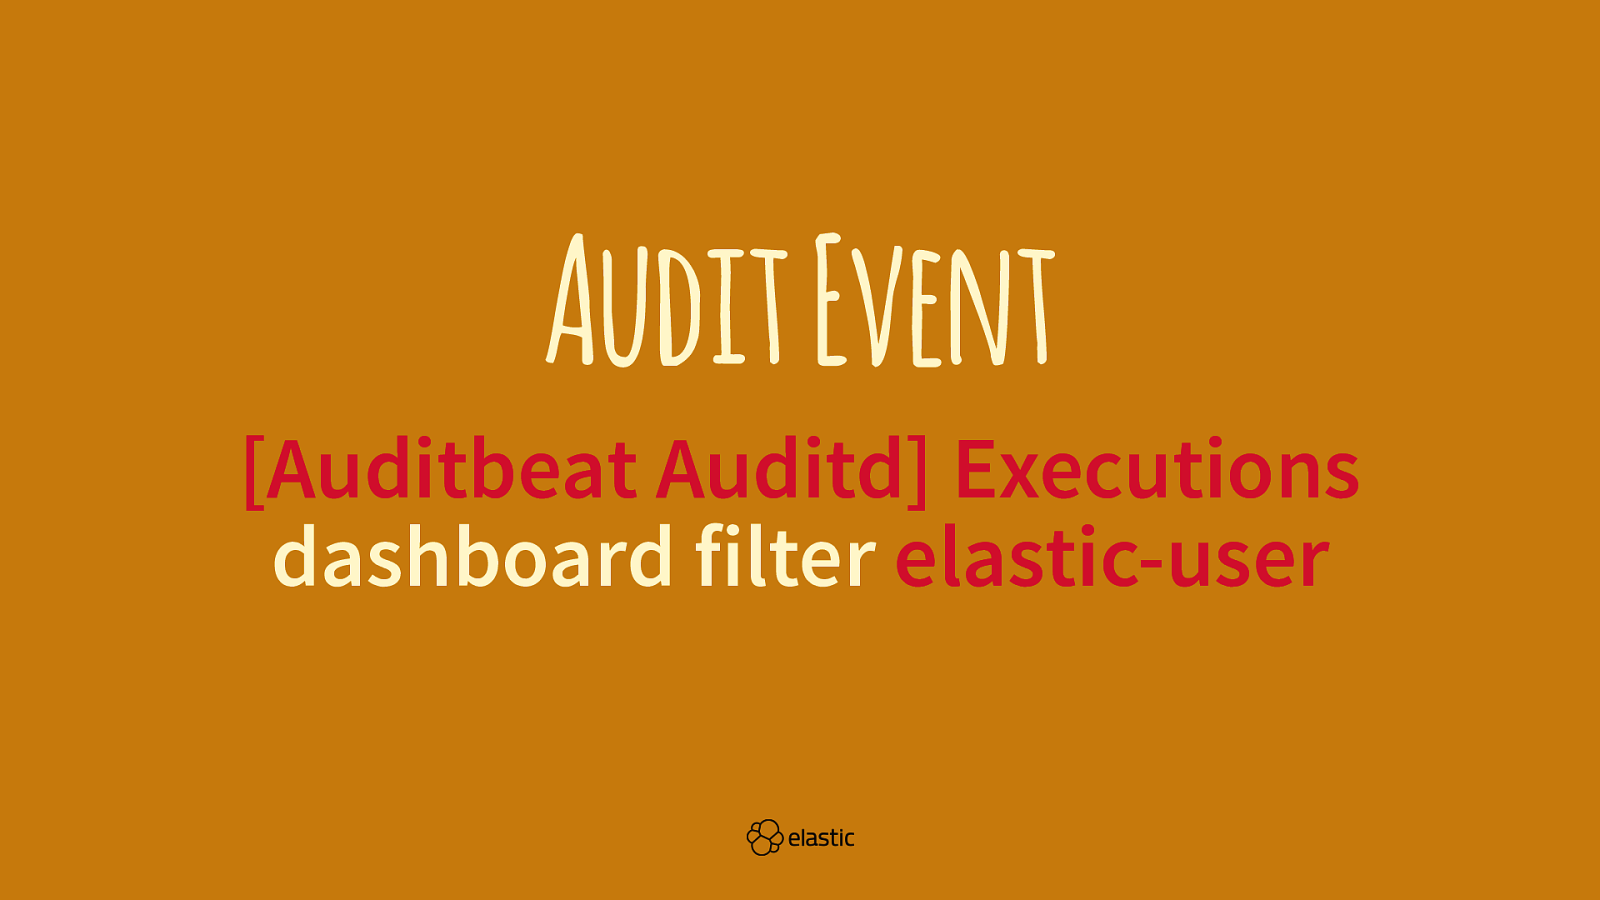
Audit Event [Auditbeat Auditd] Executions dashboard filter elastic-user
Slide 75
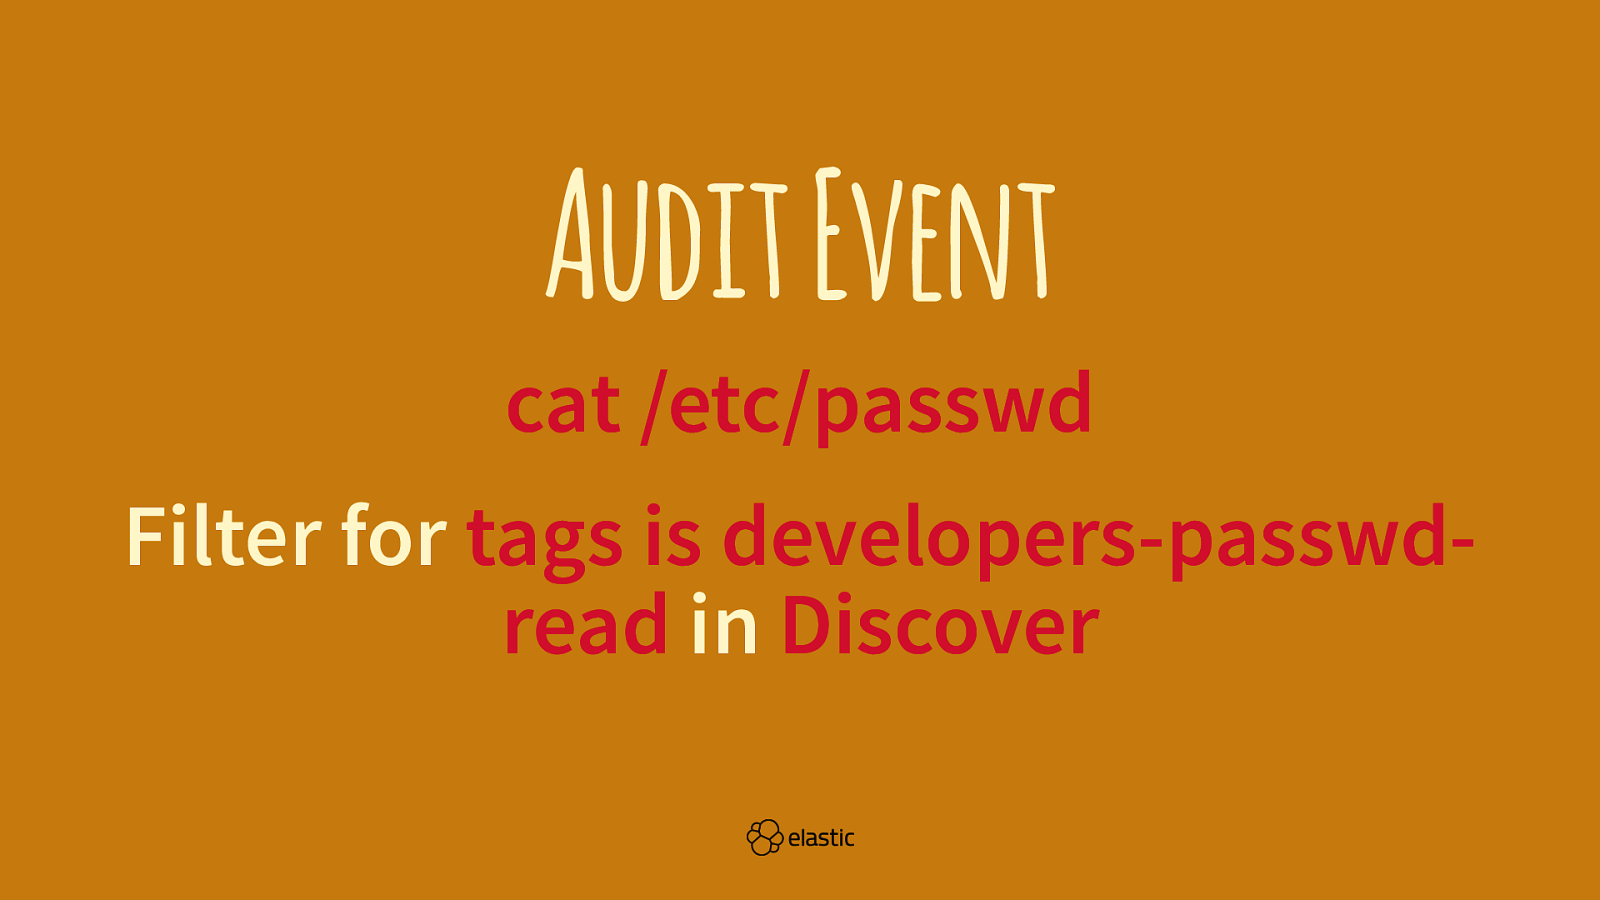
Audit Event cat /etc/passwd Filter for tags is developers-passwdread in Discover
Slide 76
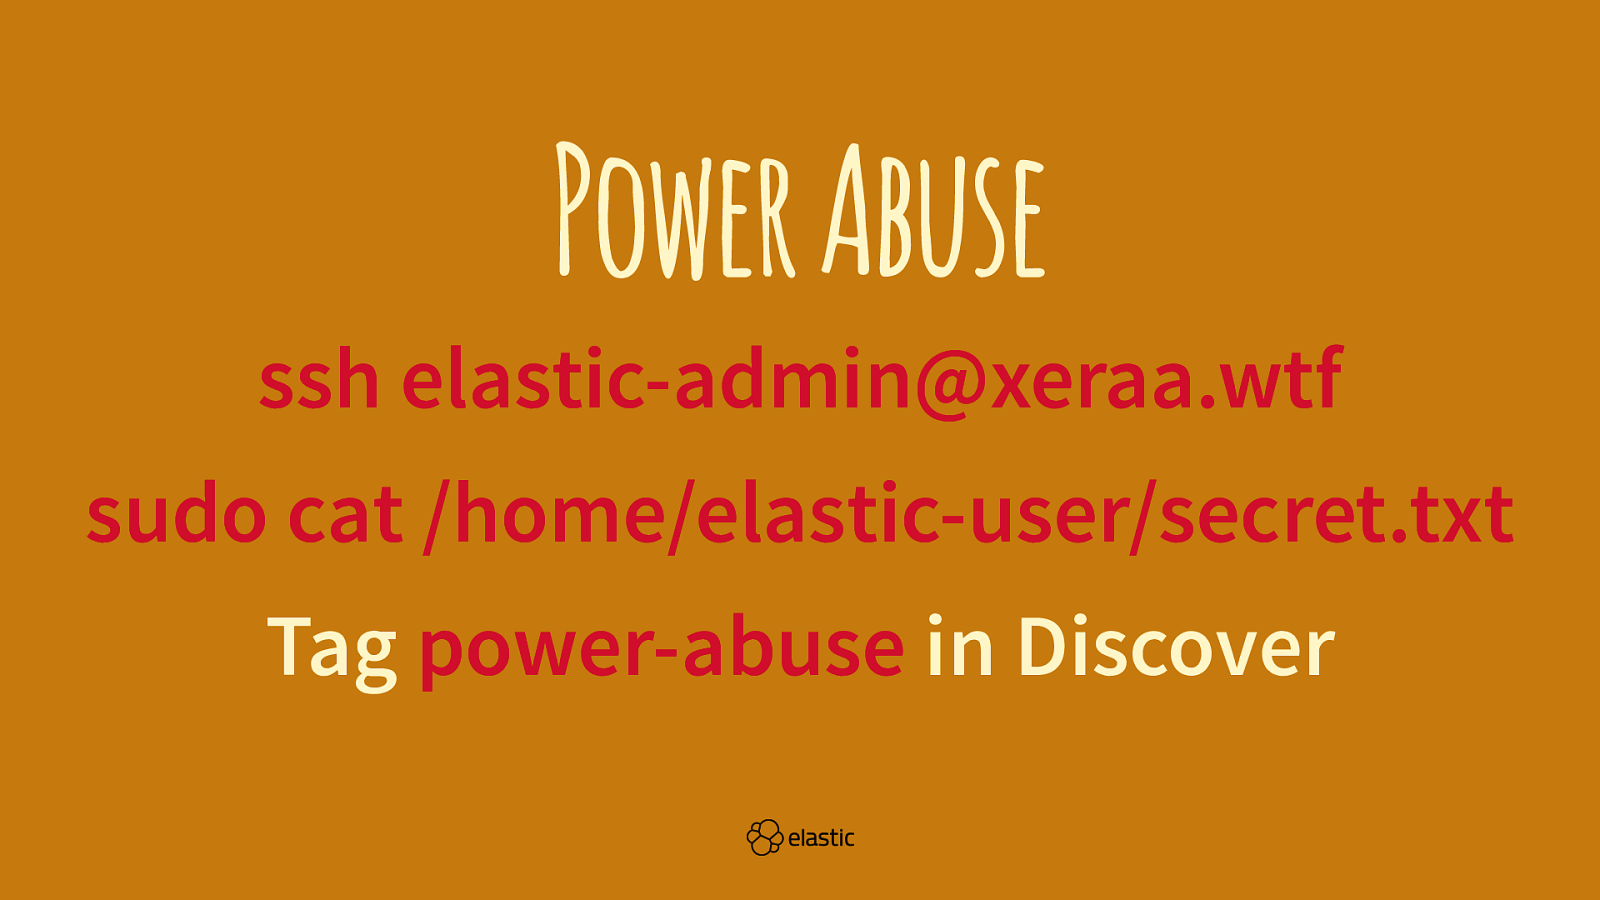
Power Abuse ssh elastic-admin@xeraa.wtf sudo cat /home/elastic-user/secret.txt Tag power-abuse in Discover
Slide 77
File Integrity Change something in /var/www/html/index.html [Auditbeat File Integrity] Overview dashboard
Slide 78

Monitor PHP
Slide 79

Heartbeat Add HTTP on port 88
Slide 80

Packetbeat Add HTTP on port 88
Slide 81
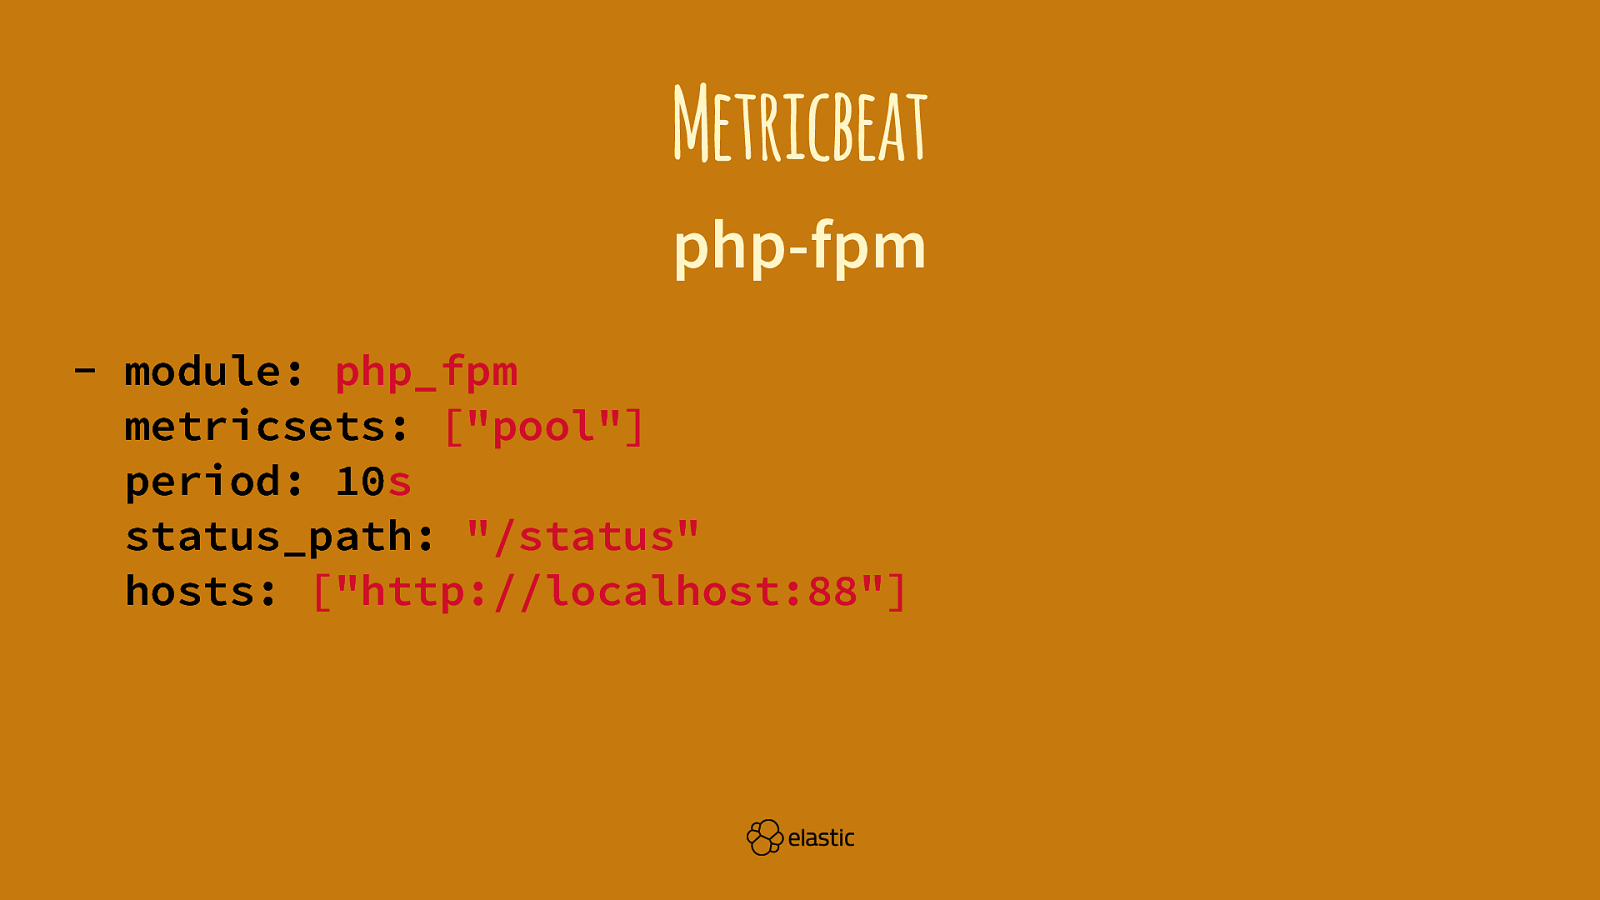
Metricbeat php-fpm - module: php_fpm metricsets: ["pool"] period: 10s status_path: "/status" hosts: ["http://localhost:88"]
Slide 82

Filebeat Collect /var/www/html/silverstripe/ logs/*.json
Slide 83

More Features
Slide 84

Slide 85

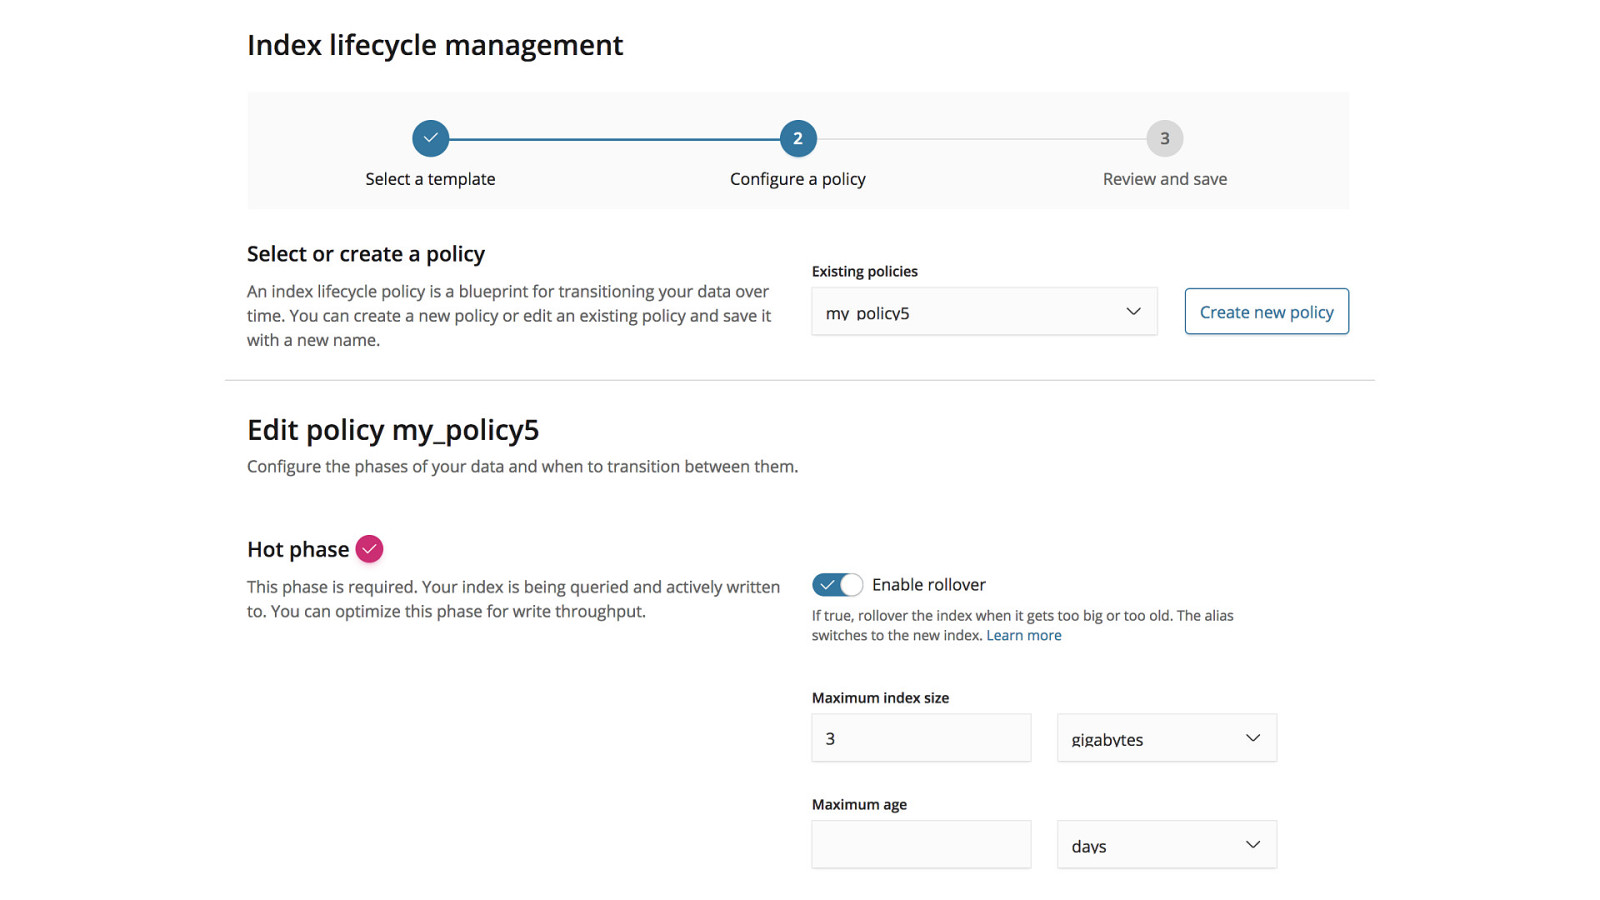
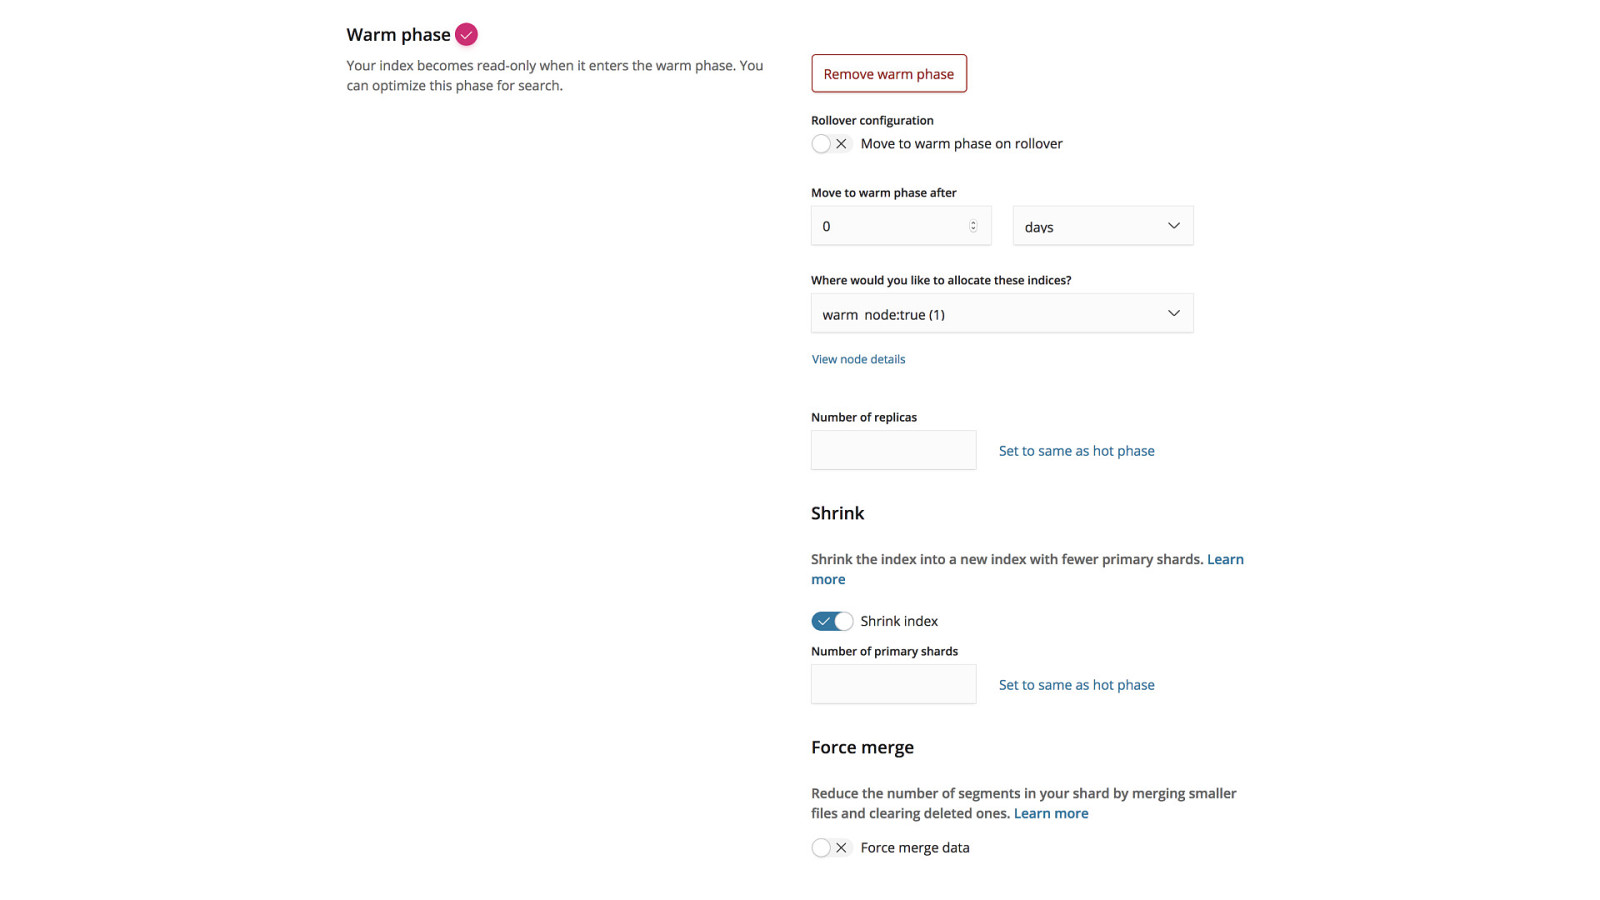
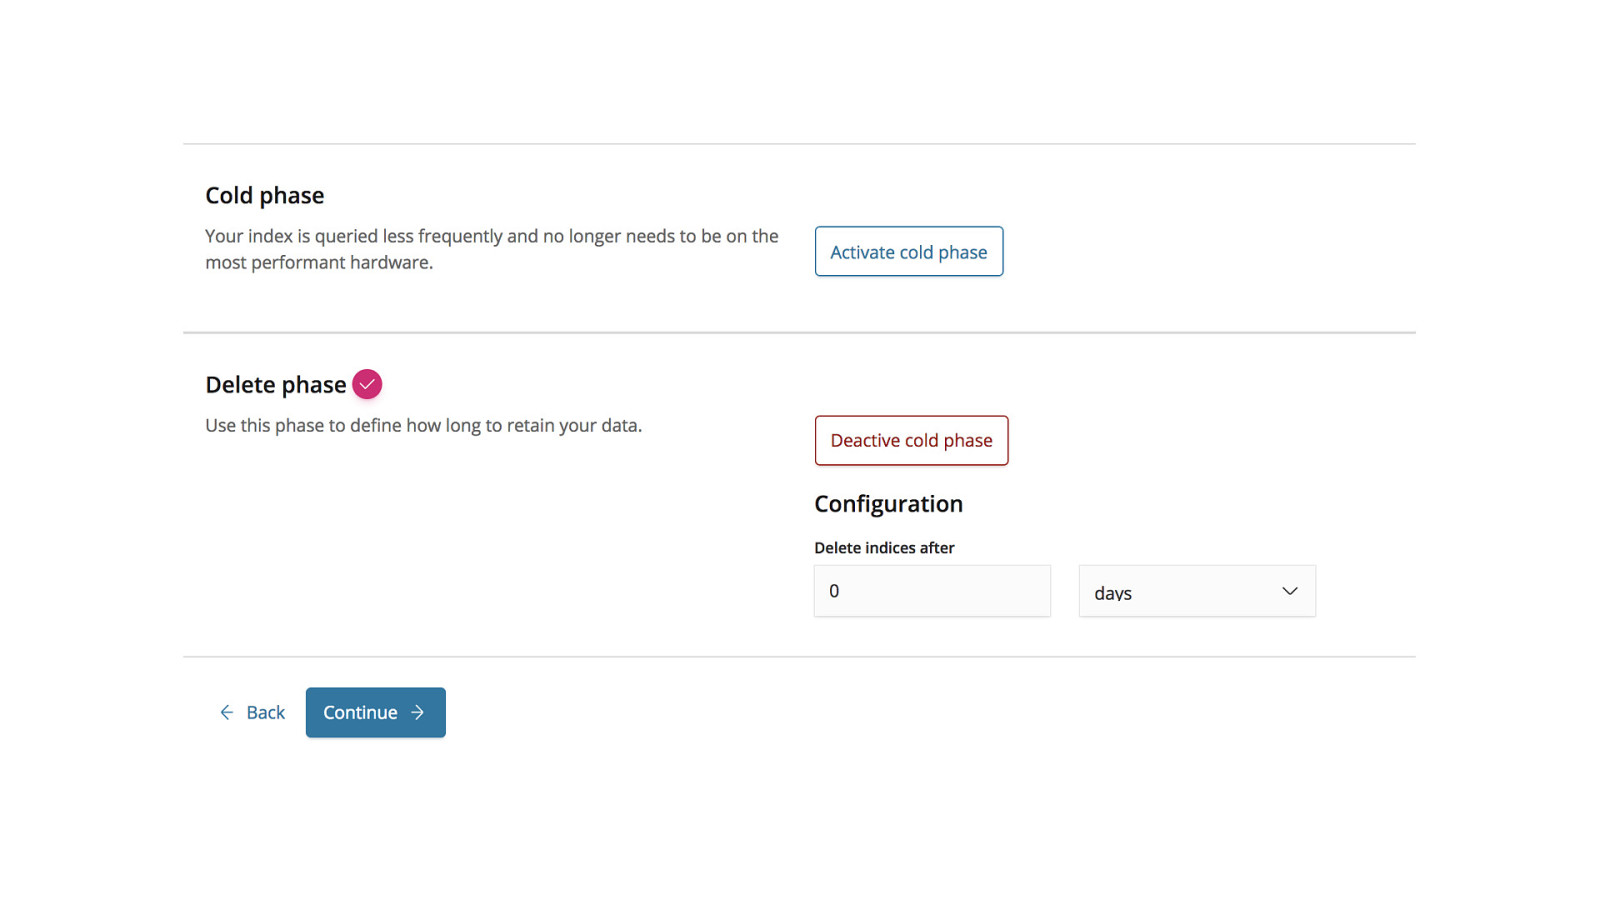
Index Lifecycle Management Currently https://github.com/elastic/curator
Slide 86
Slide 87
Slide 88
Slide 89
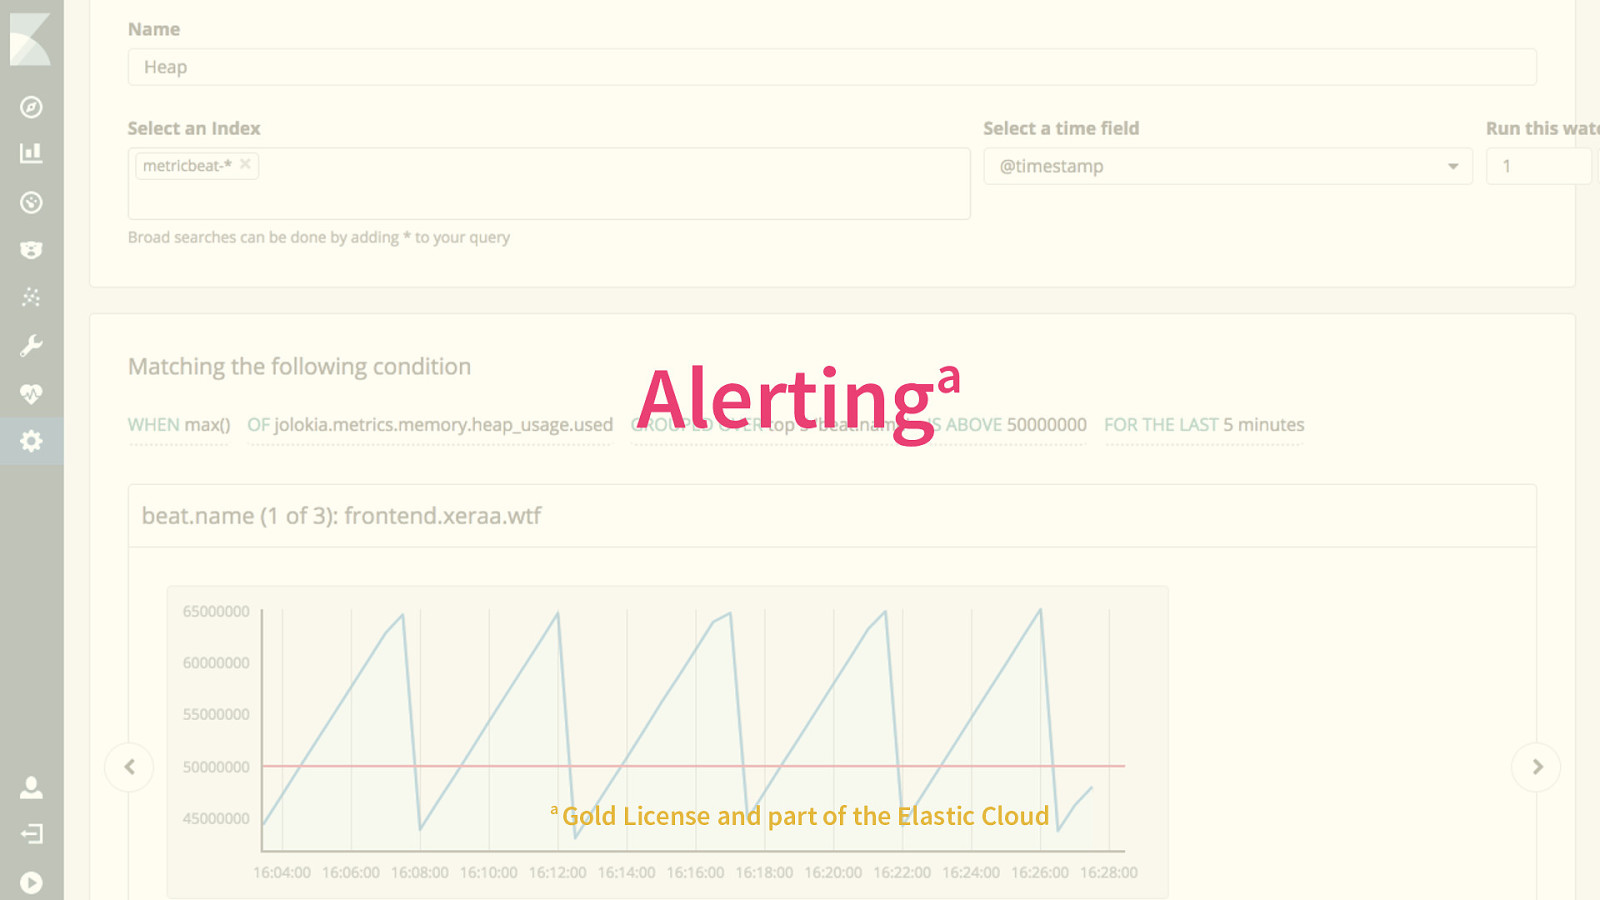
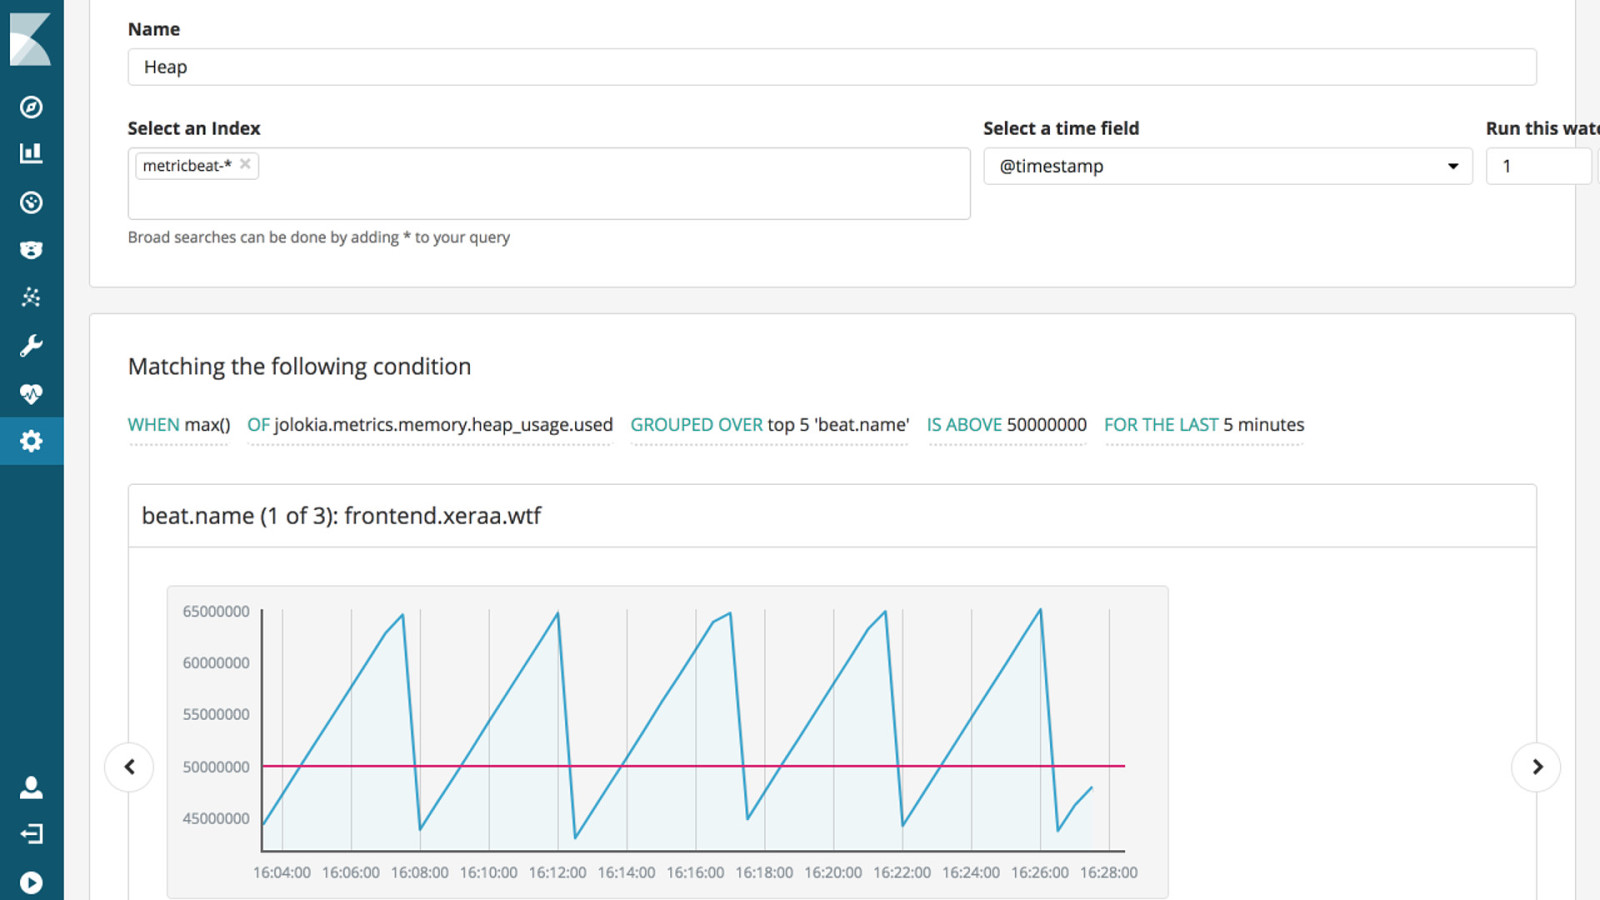
a Alerting a Gold License and part of the Elastic Cloud
Slide 90
Slide 91
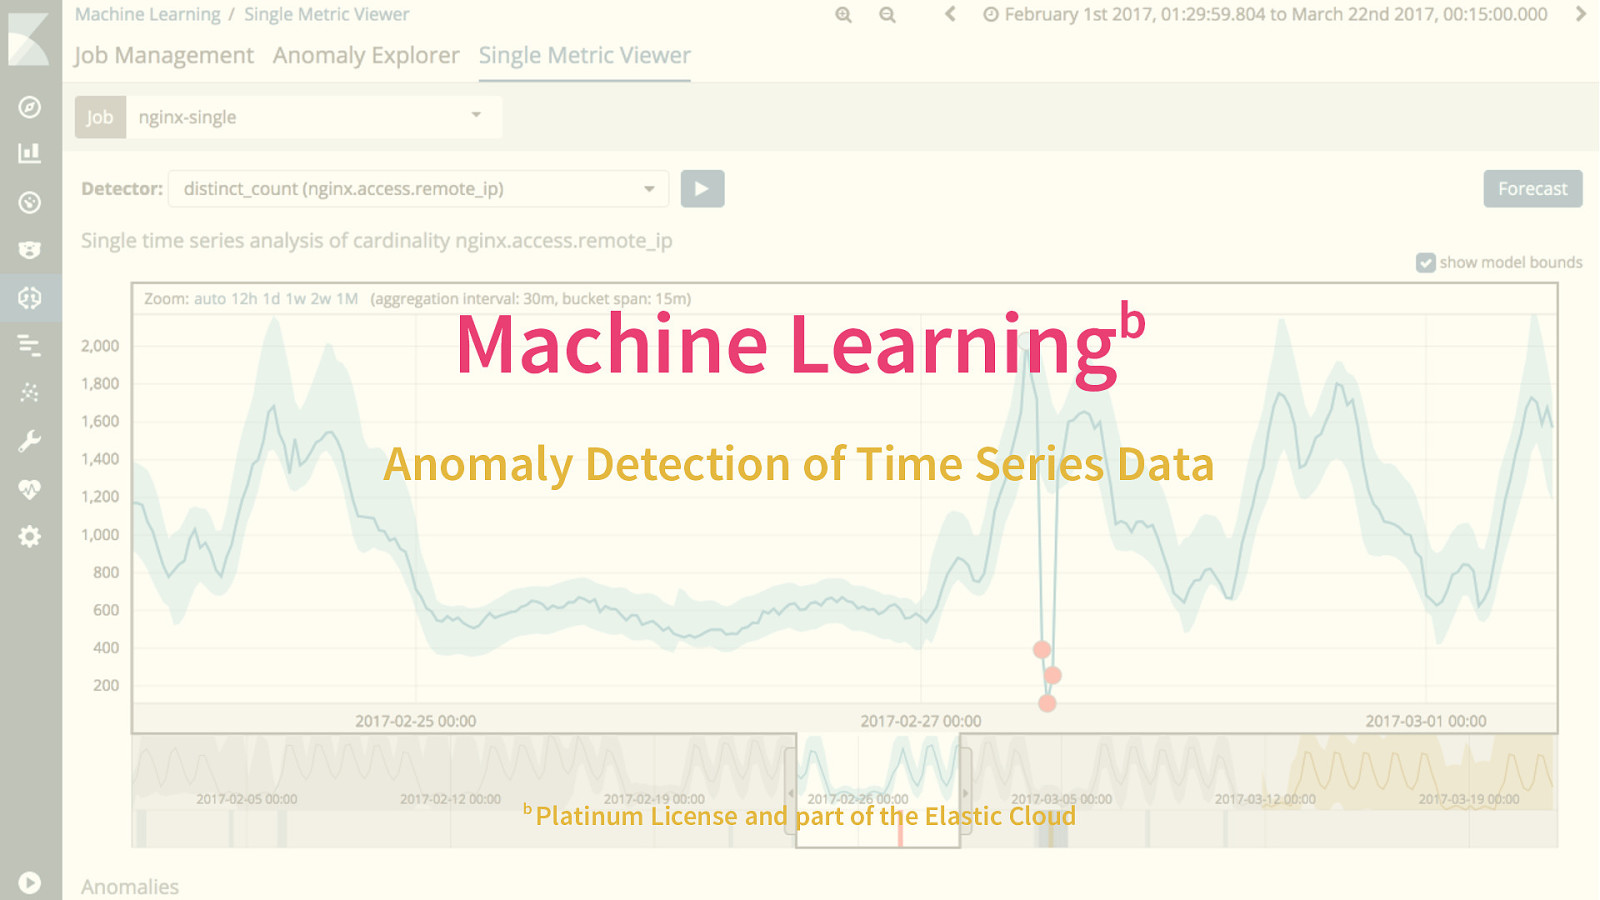
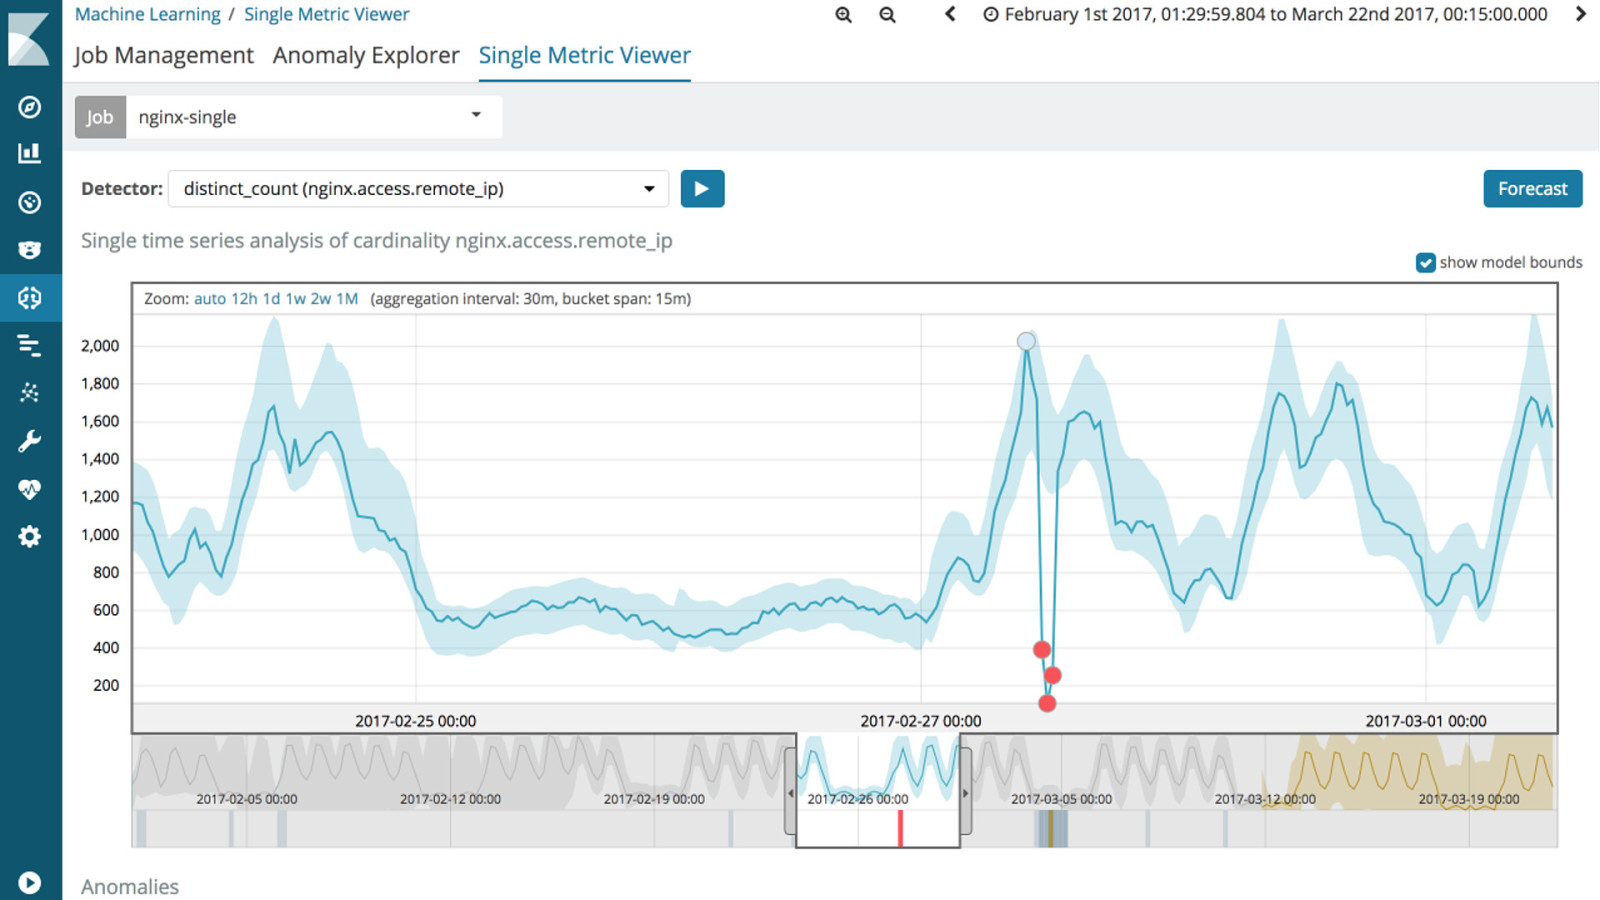
b Machine Learning Anomaly Detection of Time Series Data b Platinum License and part of the Elastic Cloud
Slide 92
Slide 93

Security c c Gold / Platinum License and part of the Elastic Cloud
Slide 94

Q&A + Your Apps
Slide 95

Conclusion
Slide 96

Slide 97
System metrics & network Filebeat modules & Auditbeat Application logs
Slide 98
Uptime Application metrics Request tracing
Slide 99
Benchmarks Fair Reproducible Close to Production
Slide 100

Slide 101

Code https://github.com/xeraa/ microservice-monitoring
Slide 102

Thank You Philipp Krenn PS: Sticker @xeraa