Monitor Your Apps with the Elastic Stack
A presentation at JNation in in Coimbra, Portugal by Philipp Krenn
Monitor Your Apps with the Philipp Krenn @xeraa


Developer
Disclaimer I build highly monitored Hello World apps
!
xeraa.wtf Your requests
Uptime Heartbeat: ICMP, TCP, HTTP(S)
Logs Filebeat: structured, enriched
Network Packetbeat: TCP/IP, HTTP, MySQL, TLS
Metrics Metricbeat: host, apps (heap usage)
Security Auditbeat: users, systems, executions
APM / Tracing Java, Node.js, Python, Ruby, Go, .NET
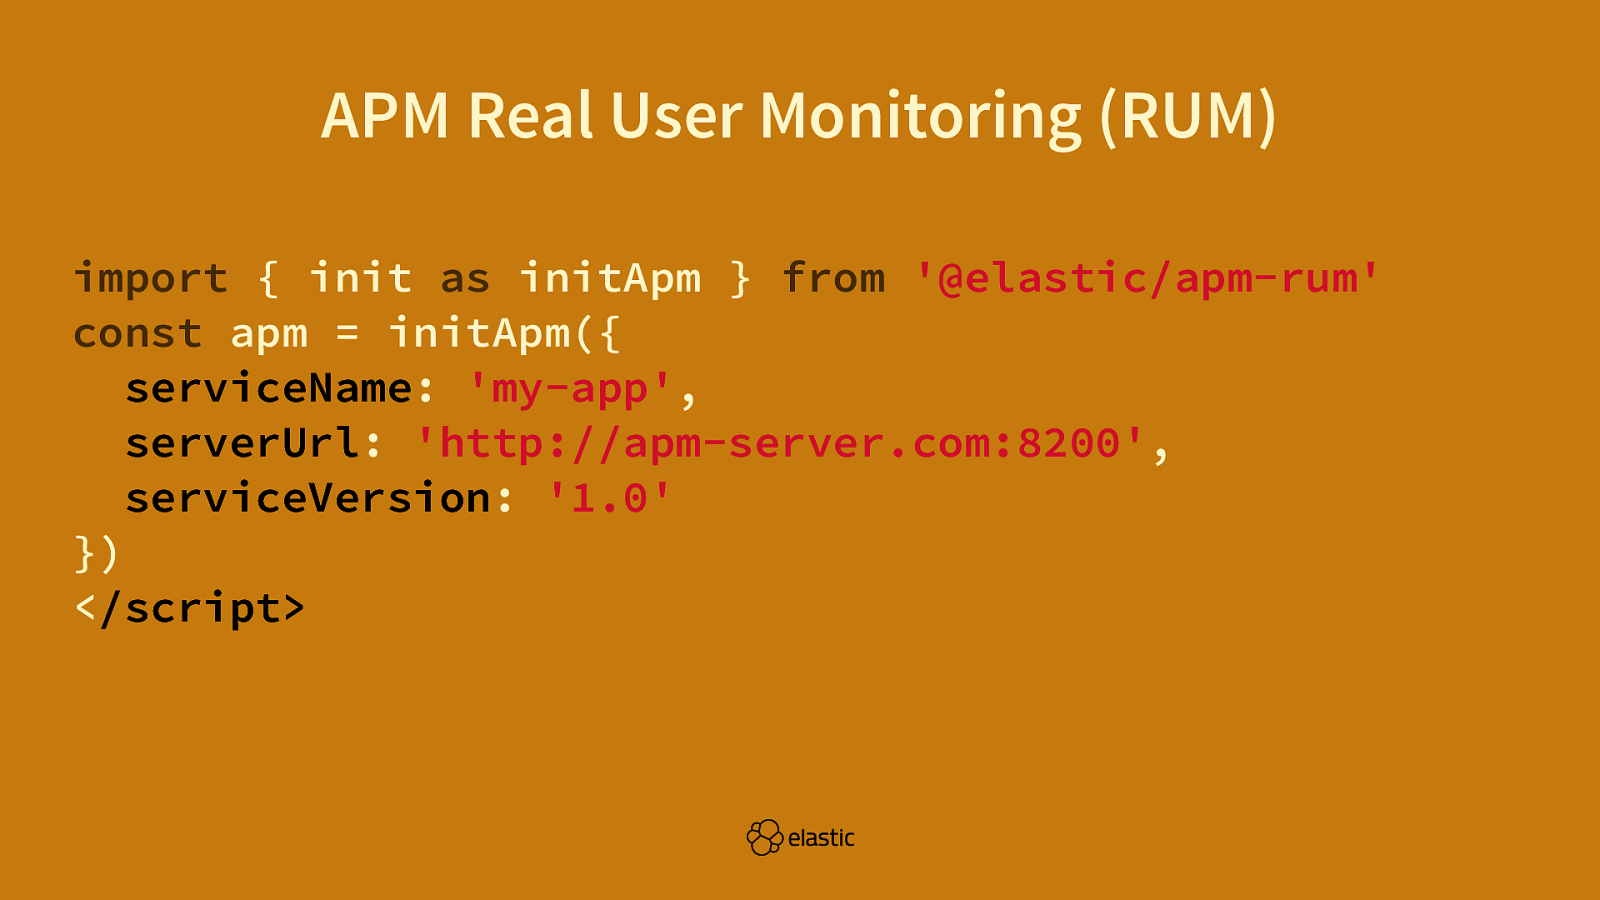
APM Real User Monitoring (RUM) import { init as initApm } from ‘@elastic/apm-rum’ const apm = initApm({ serviceName: ‘my-app’, serverUrl: ‘http://apm-server.com:8200’, serviceVersion: ‘1.0’ }) </script>

More
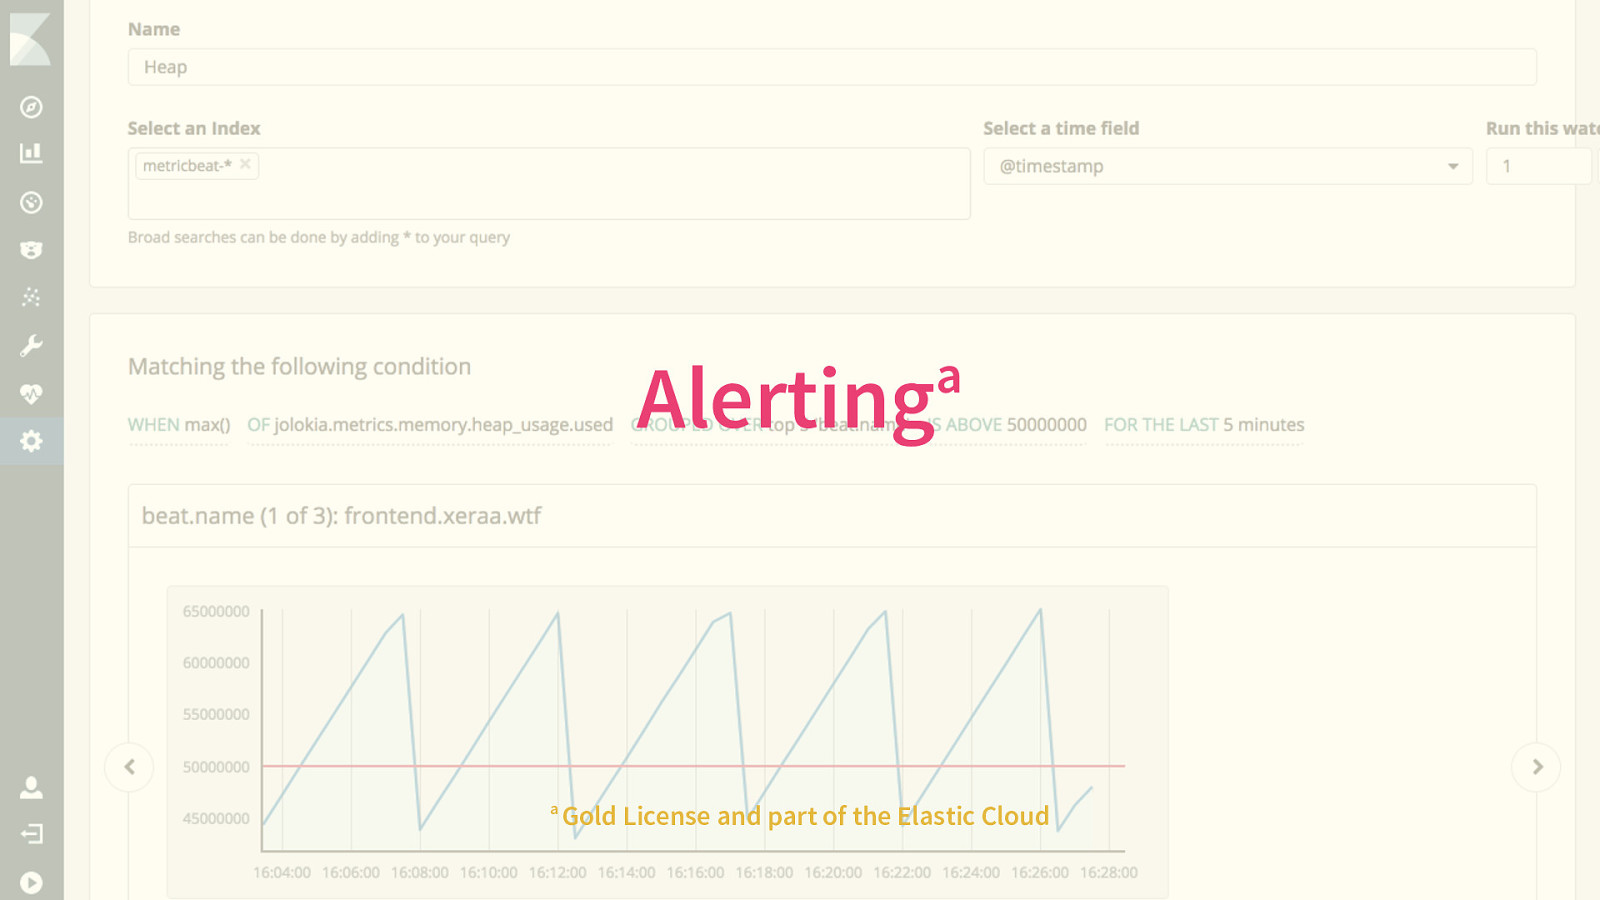
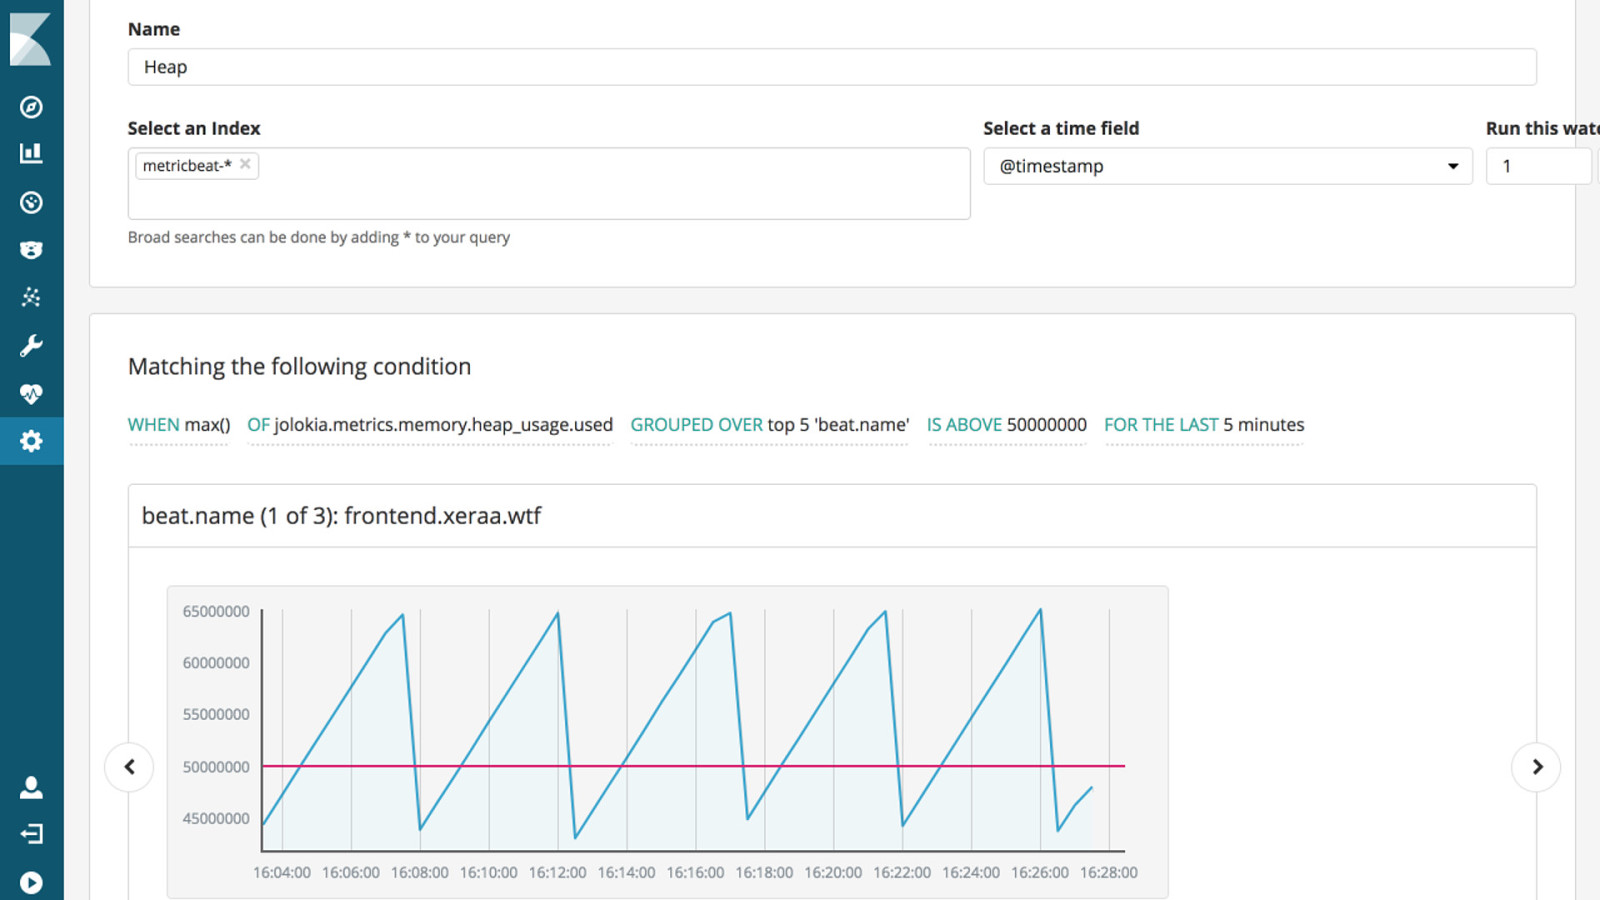
a Alerting a Gold License and part of the Elastic Cloud
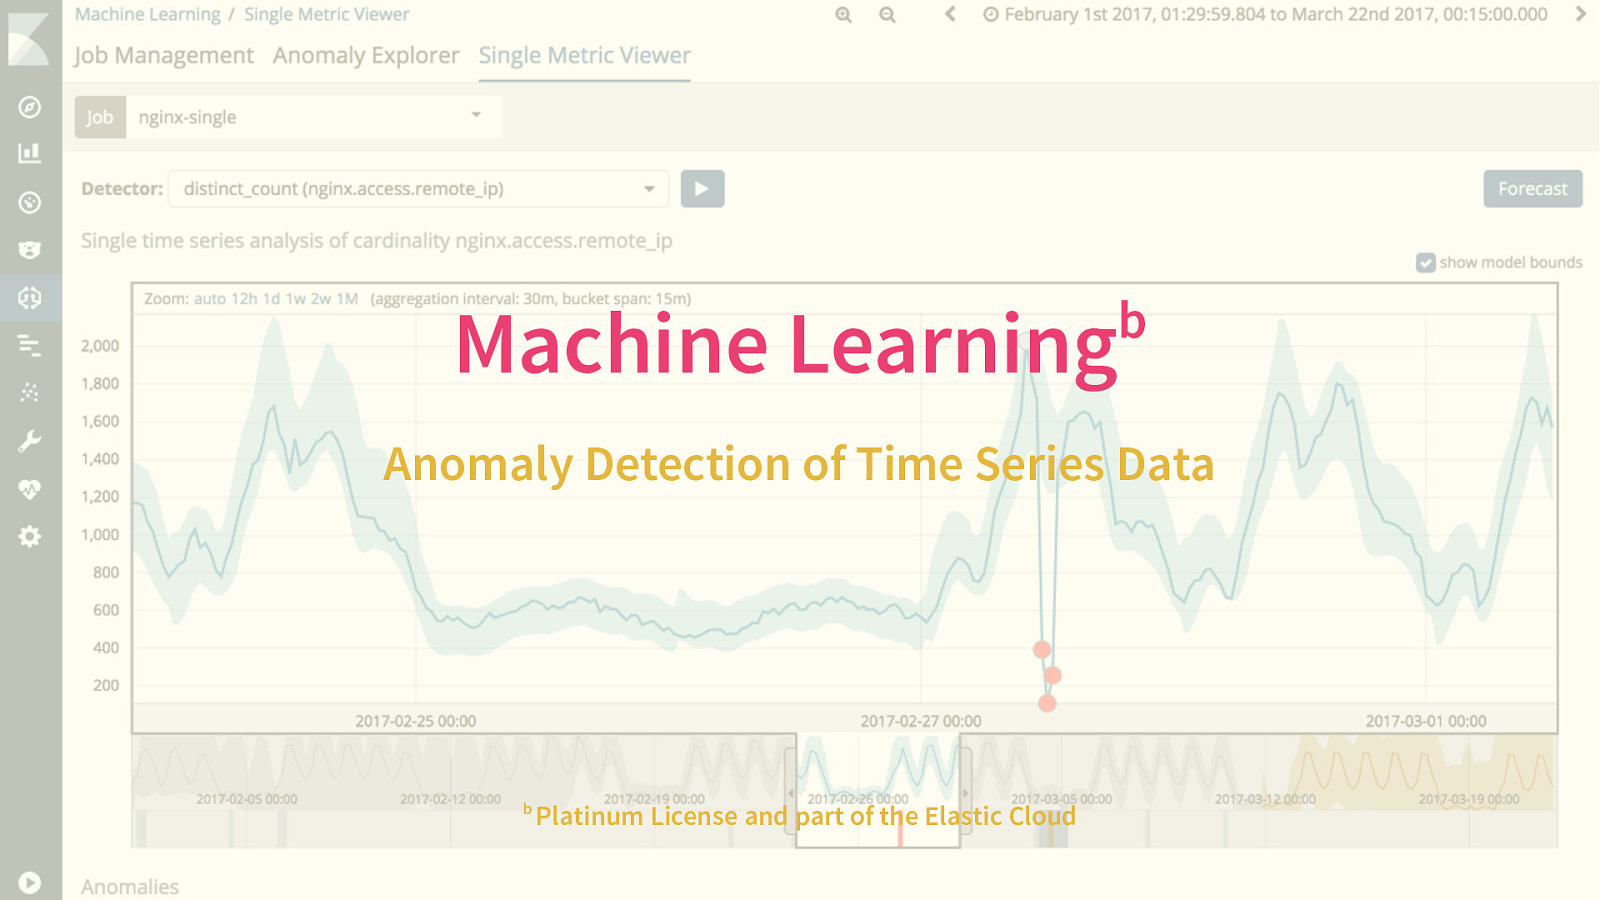
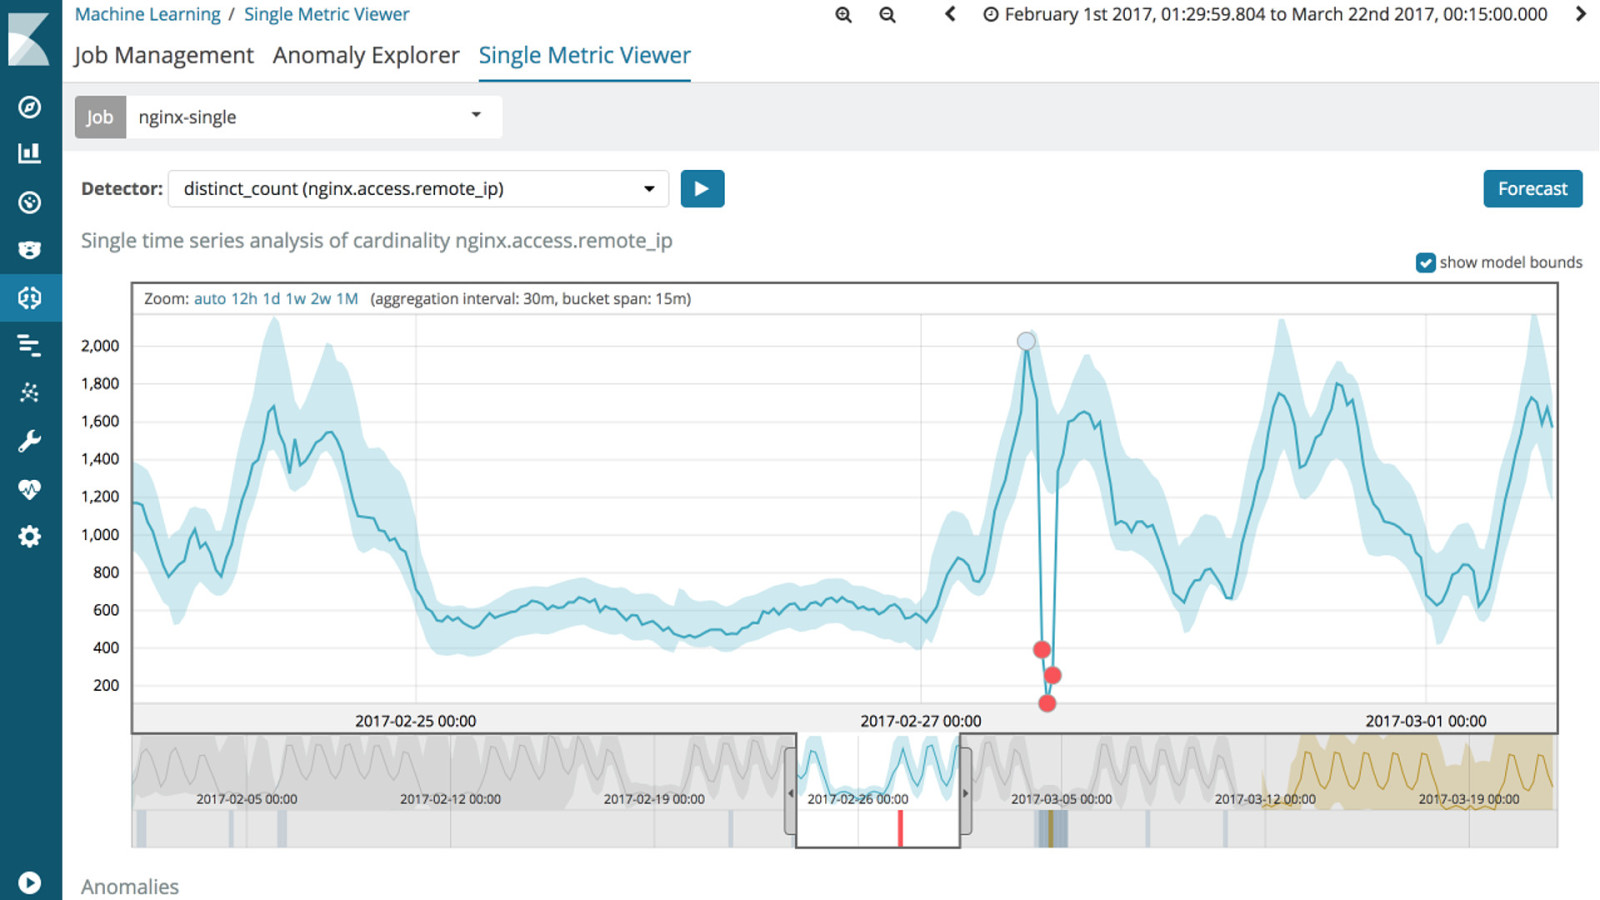
b Machine Learning Anomaly Detection of Time Series Data b Platinum License and part of the Elastic Cloud

Conclusion


From to !
Code https://github.com/xeraa/ microservice-monitoring

Questions? Philipp Krenn PS: Sticker @xeraa

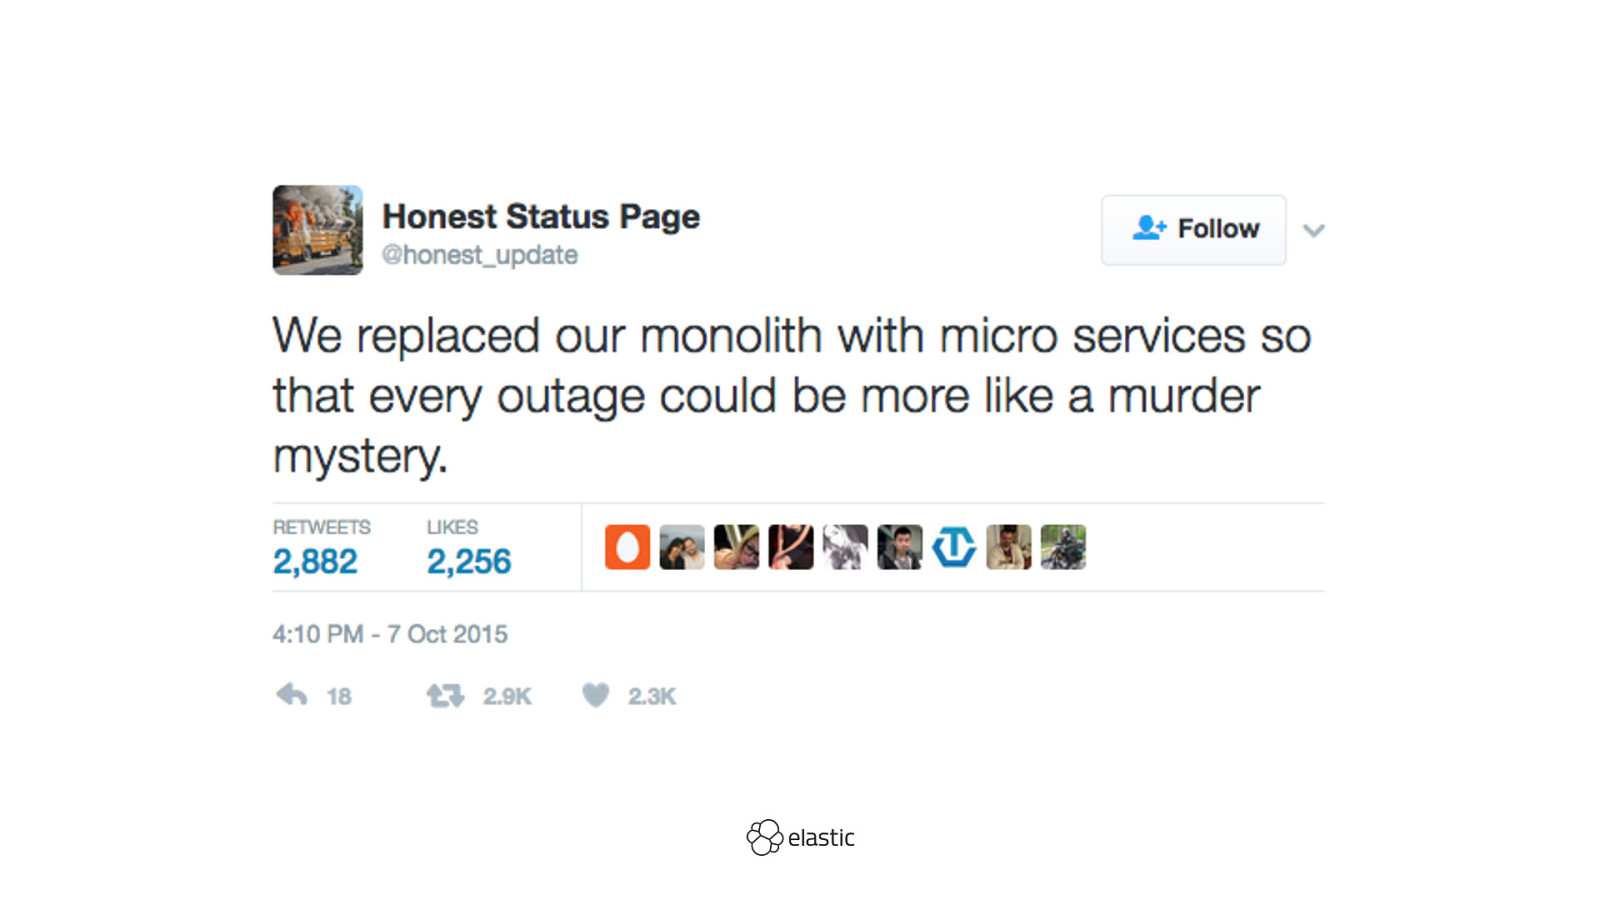
“With microservices every outage is like a murder mystery” is a common complaint. But it doesn’t have to be! This talk gives an overview on how to monitor (distributed) applications. We dive into:
- Uptime monitoring: Ping services and actively monitor their health and response time.
- Application logs: Collect structured logs in a central location.
- Network monitoring: Find out what is happening on the network.
- System metrics: Keep track of network traffic and system load.
- Security events: Collect who is doing what when to find malicious actors.
- Application metrics: Get the information from the application’s metrics and health endpoints via REST or JMX to see how your heap is filling up.
- Request tracing: Trace requests through a distributed system and show how long each call takes and where errors are happening.
And we do all of that live, since it is so easy and much more interactive that way using Elasticsearch Service on Elastic Cloud.
 for free. You
can too.
for free. You
can too.
Resources
The following resources were mentioned during the presentation or are useful additional information.
-
GitHub Demo Code
Monitor your Spring Boot application with the Elastic Stack all around.